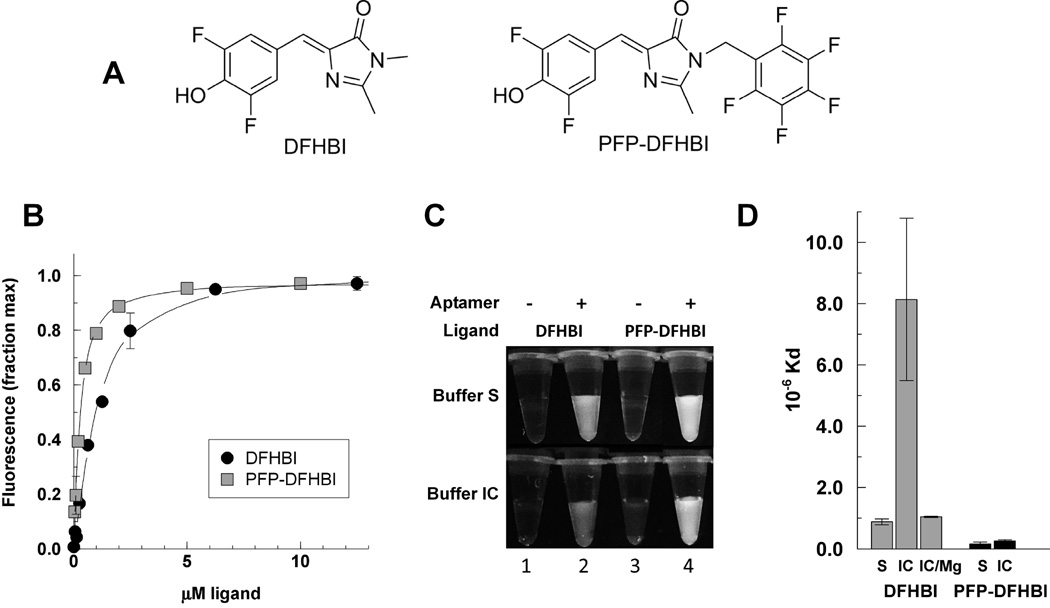
Figure 1. Affinities of Spinach2 for DFHBI and PFP-DFHBI and effect of Mg on the interactions.
A) Chemical structures. B) The ligands were measured for their affinity to the Spinach aptamer by the increase in fluorescence as a function of the ligand concentration in buffer S. C) Fluorescence of DFHBI versus PFP-DFHBI under UV illumination with 254nm UV lamp. D) Kds of DFHBI and PFP-DFHBI determined as in B in buffer S (black bars) or buffer IC (grey bars). Error bars are the standard deviations of two or more independent replicates under the same conditions.

