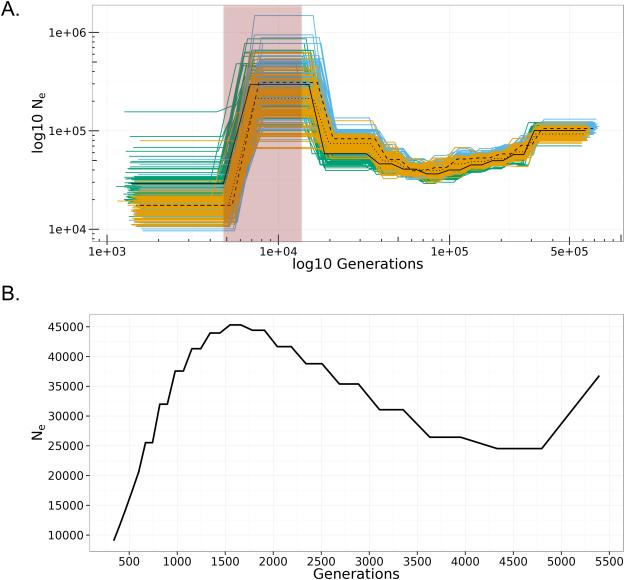
Figure 3. Reconstruction of Historical Demography.
A) Pairwise sequential Markovian coalescent (PSMC) plots of individual Wb L3 worm genomes: L3-17E (green/solid), L3-4873 (orange/dotted), L3-74E (blue/dash). The horizontal axis represents time in Log10 generations, while the vertical axis represents the Log10 of Ne (effective population size). Clusters of like-colored lines indicate bootstrapping support for each trajectory, while heavy colored lines indicate mean values. The shaded region (red box) corresponds to the peak effective population size of Anopheles farauti no 4. from Logue et al. (2015). B) Multiple sequential Markovian coalescent (MSMC) of 6 haplotypes from three unrelated Wb L3 worms: L3-17E, L3-4873, and L3-4853. The horizontal axis represents time in generations, while the vertical axis represents Ne, the effective population size.

