Figure 2.
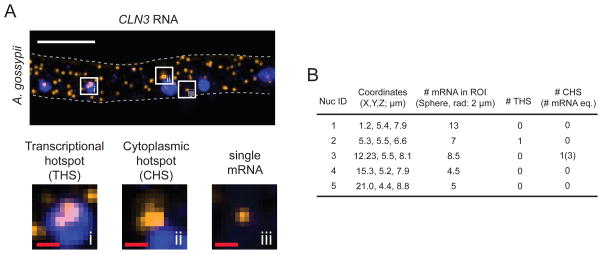
Analysis of smFISH data (A) A transcriptional hotspot (THS), cytoplasmic hotspot (CHS), and single mRNA spot are shown as a maximum-intensity Z-projection. Each white square box is enlarged in the bottom panel. The gray dashed line indicates the cell outline. White scale bar: 5 μm. Red scale bars: 500 nm. (B) An example of output data (Material 5) generated by the customized MATLAB code (Materials 4,6). The coordinates in the table refer to the positions of nuclei in the smFISH image shown in A. The top-left corner of the image represents 0 μm for X and Y coordinates. In the Z-stack of the smFISH image, the bottom Z-slice represents 0 μm for Z coordinate. The MATLAB data includes the following: the number of mRNAs within 2 μm of the center point of each nucleus (i.e. within a spherical ROI with a 2 μm radius), the number of THSs detected within each nucleus, and the number of CHSs detected within 2 μm of the center point of the nucleus. The number of mRNAs within a CHS is indicated in parentheses, and was calculated from the intensity value of a single mRNA determined for this hypha.

