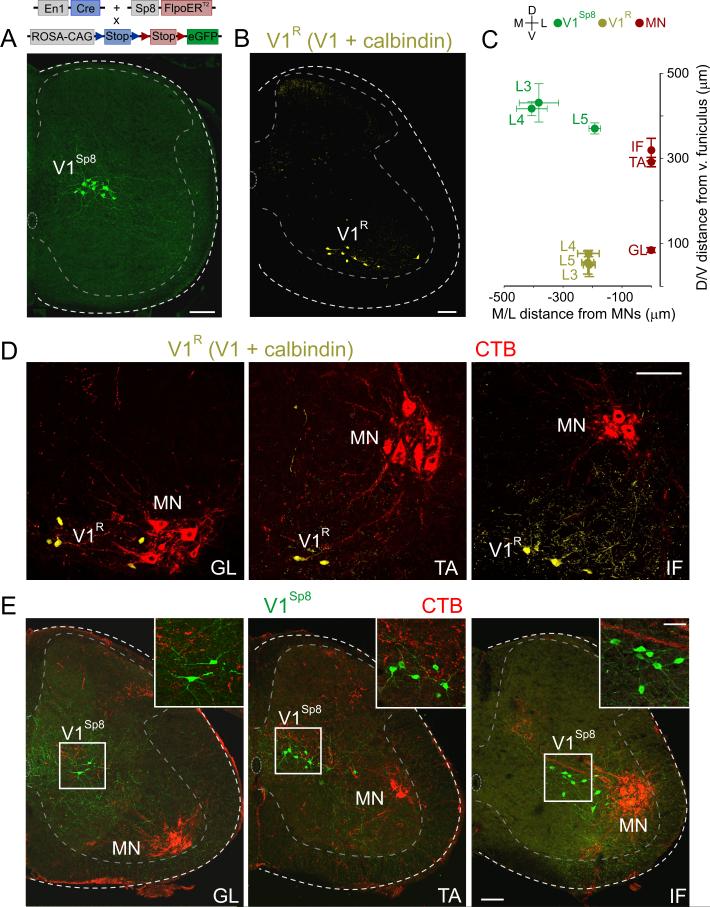
Figure 5. Relative Position of V1R and V1Sp8 Interneurons to Motor Pools.
(A) V1Sp8 interneurons (green), in p12 lumbar spinal cord of En1::Cre; Sp8::FlpoERT2; RCE.dual.GFP mice.
(B) V1R interneurons (yellow, colocalization mask of eGFP and calbindin immunoreactivity) in ~p21 En1::Cre; RCE.lsl.GFP lumbar spinal cord.
(C) V1R and V1Sp8 position with respect to GL, TA, and IF motor pools in ~p21 mice. Motor pool D/V positions: GL: 84 ± 3 μm, TA: 291 ± 6 μm, IF: 321 ± 15 μm, from dorsal border of ventral funiculus.
(D) D/V position of V1R interneurons (yellow) with respect to CTB-backfilled GL, TA, and IF motor pools (MN, red) in ~p21 lumbar spinal cord. D/V distances: V1R ventral to GL, TA, and IF motor neurons by 8 ± 3 μm, 242 ± 14 μm, and 264 ± 13 μm, respectively. p < 0.0001, one-way ANOVA; Bonferroni post-hoc test: p < 0.001, TA or IF vs GL. M/L distances were not significantly different (p = 0.99, one-way ANOVA).
(E) D/V position of V1Sp8 interneurons (green) with respect to CTB-backfilled GL, TA, and IF motor pools (red) in ~p21 lumbar spinal cord. V1Sp8 dorsal to GL, TA, and IF by 332 ± 8 μm, 139 ± 23 μm, and 50 ± 8 μm, respectively (p < 0.0001, one-way ANOVA; Bonferroni post-hoc test: p < 0.001, TA or IF vs GL; p < 0.05, TA vs IF). In the M/L axis, V1Sp8 interneurons were significantly closer to IF than to GL or TA (192 ± 11 μm versus 406 ± 26 μm or 382 ± 33 μm, respectively; p < 0.01, one-way ANOVA; Bonferroni post-hoc test; p < 0.01, IF vs GL or TA). Values are mean ± SEM, n ≥ 3 animals per condition. Scale bars = 100 μm or 50 μm (inset). See also Figure S6.

