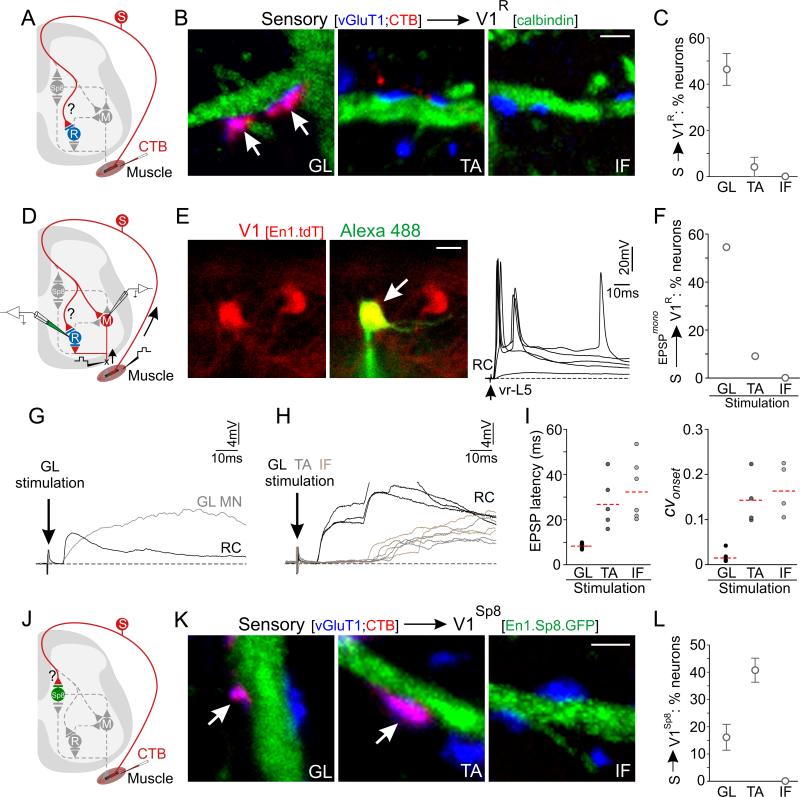
Figure 6. Specificity of Sensory-Interneuron Connectivity at Individual Joints.
(A) Assay of proprioceptive input to V1R interneurons.
(B-C) CTB+; vGluT1+ proprioceptive input to V1R interneurons. (C) Percent of V1R interneurons with pool-specific input. p = 0.0007, one-way ANOVA; Bonferroni post-hoc test: p < 0.01, GL vs TA or IF, n = 3 animals. Innervation density (inputs/100 μm dendrite) for neurons receiving sensory input: GL, 5.1 ± 1.0; TA, 2.8 ± 1.9. All data are mean ± SEM. Scale bar = 2 μm.
(D) Assay of monosynaptic input from pool-specific Ia afferents onto V1R interneurons.
(E) Left, V1R interneurons (red, labeled in En1::Cre; Rosa.lsl.tdT mice) targeted for intracellular recording, filled with Alexa-488 hydrazide (green). Right, stimulation of L5 ventral root (vr-L5) at different intensities evoked graded short-latency synaptic potentials. Scale bar = 10 μm.
(F) V1R interneurons (GL: 6/11 cells; TA: 1/11 cells; IF: 0/11 cells) receiving monosynaptically-evoked EPSPs from peripheral muscles.
(G) Monosynaptic EPSPs in a V1R interneuron (black) or GL motor neuron (gray) following GL muscle stimulation.
(H) Short-latency EPSPs evoked in V1R interneurons after GL stimulation (3 superimposed responses evoked at 0.1 Hz stimulation frequency, black). Stimulation from TA (gray) or IF (brown) muscle sensory fibers resulted in long (>20 msec), variable latencies, indicative of polysynaptic activation. Arrow, stimulation artifact.
(I) Left, latencies from synaptically evoked responses in V1R interneurons after stimulation of GL, TA, and IF muscles in p4 to p5 mice. The latency from GL muscle stimulation was significantly shorter than from TA or IF (p < 0.05, one-way ANOVA). Right, coefficient of variation (CVonset) of synaptic response latency. Red line = mean.
(J) Assay of proprioceptive sensory input onto V1Sp8 interneurons.
(K-L) CTB+; vGluT1+ proprioceptive input to V1Sp8 interneurons. (L) V1Sp8 interneurons with pool-specific input. p = 0.004, one-way ANOVA; Bonferroni post hoc test: p < 0.01, GL vs TA; p < 0.001, TA vs IF; n.s., GL vs IF, n ≥ 3 animals. Average CTB+; vGluT1+ input density/100 μm of V1Sp8 dendrite: GL: 0.92 ± 0.23; TA: 2.20 ± 0.14; IF: 0 ± 0; p < 0.0001, oneway ANOVA; Bonferroni post hoc test: p < 0.01, GL vs TA; p < 0.05, GL vs IF; p < 0.001, TA vs IF. Similar labeling efficiency was observed for GL, TA, and IF sensory afferents (Figure S7C). Scale bar = 2 μm. See also Figure S7.

