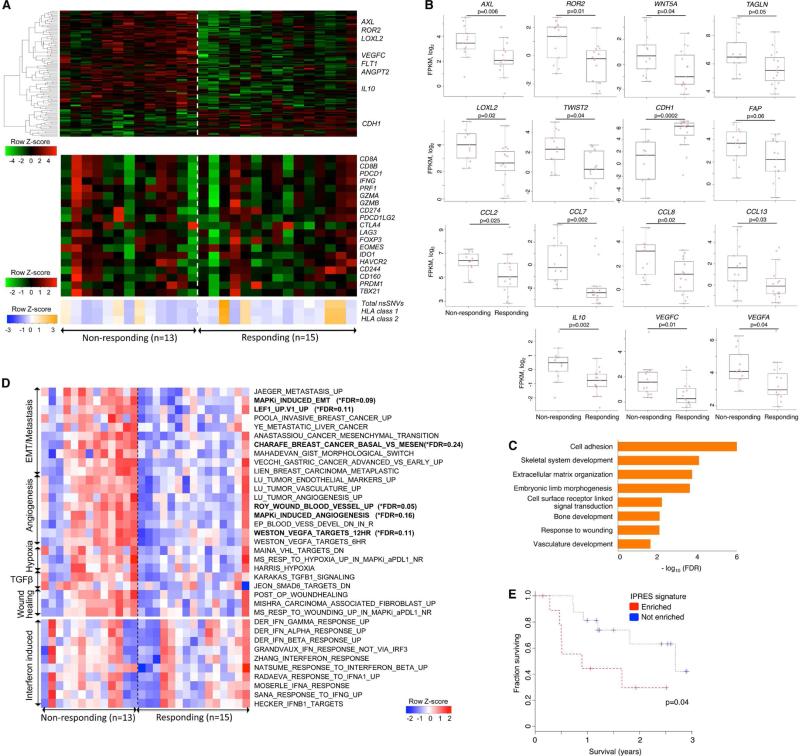
Figure 2. Transcriptomic Signatures of Innate Resistance to Anti-PD-1 Therapy.
(A) (Top) Heatmap showing differentially expressed genes in the pretreatment tumors derived from patients who responded versus who did not respond to anti-PD-1 treatment (gene expression with inter-quartile range (IQR) ≥ 2; median fold-change (FC) difference ≥ 2; Mann-Whitney P ≤ 0.05). (Middle) mRNA expression levels of genes with hypothetical roles in modulating response patterns to anti-PD-1 therapy. (Bottom) Overall number of nsSNVs, HLA class 1 and 2 neoepitopes (predicted).
(B) mRNA levels of genes (which control tumor cell mesenchymal transition, tumor angiogenesis and macrophage and monocyte chemotaxis) that were differentially expressed between the responding versus non-responding pretreatment tumors. P values, Mann Whitney test.
(C) GO enrichment of genes that were expressed higher in the responding tumors.
(D) Heatmap showing the Gene Set Variance Analysis (GSVA) scores of gene signatures differentially enriched in the responding versus non-responding pre-anti-PD-1 tumors (absolute median GSVA score difference ≥ 10%, FDR-corrected Welch t-test p≤0.25 or nominal Welch t-test p≤0.1). For comparison, enrichment scores of interferon signatures are also displayed.
(E) Overall survival of anti-PD-1-treated melanoma patients with presence (n=10) or absence (n=16) of co-enriched Innate Anti-PD-1 RESistance (IPRES) signatures. P value, log-rank test.

