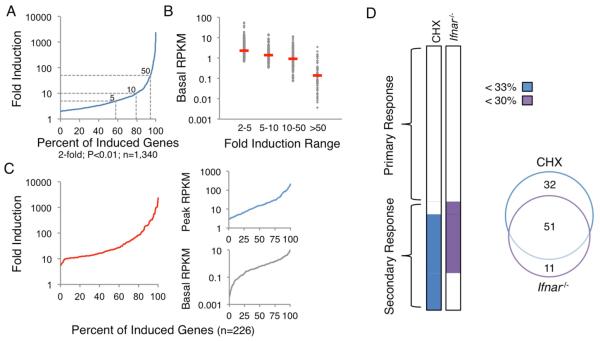
Figure 1. Properties of the Lipid A-Induced Transcriptional Cascade.
Chromatin-associated transcripts from BMDMs stimulated with lipid A were analyzed by RNA-seq.
(A) The distribution of maximum fold induction values over the 2-hr stimulation period is shown for the 1,340 significantly induced (2-fold, p<0.01) and expressed (3 RPKM) genes. With multiple hypothesis testing, two weakly induced genes exhibited q values >0.01. The dashed gray lines represent 5-, 10-, and 50-fold induction thresholds.
(B) The 1,340 induced genes were grouped into bins, with basal RPKMs shown for each bin and red dashes indicating median RPKMs.
(C) The distributions of maximum fold inductions (left), peak RPKMs (top right), and basal RPKMs (bottom right) are shown for the 226 genes selected for analysis.
(D) The 226 genes were separated into PRG and SRG groups on the basis of their expression in CHX-treated and Ifnar−/− BMDMs. Genes were classified as SRGs if they were expressed <33% in CHX or <30% in Ifnar−/− samples. The Venn diagram indicates the number of genes affected by CHX treatment, the absence of IFNAR, or both.

