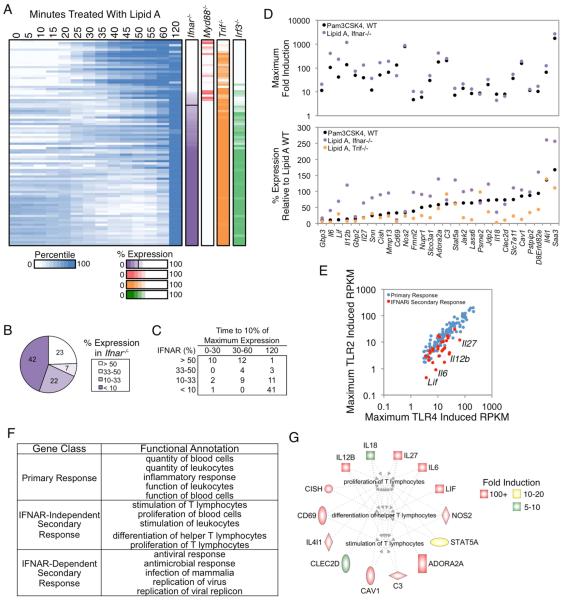
Figure 2. Analysis of IFNAR-Independent and -Dependent SRGs.
(A) Activation kinetics are shown for SRGs from BMDMs stimulated at 5-min intervals from 0-60 min, with an additional 120-min time point. Shades of blue indicate percentile values. Genes were sorted on their maximum percent expression in Ifnar−/− BMDMs relative to WT BMDMs (purple column). The maximum percent expressions in Myd88−/−, Trif−/−, and Irf3−/− are shown to the right. See also Figure S1.
(B) The distribution of genes in IFNAR-dependence bins based on their expression in Ifnar−/− BMDMs is shown.
(C) The time point at which each SRG in the IFN-dependence bins reached 10% of its maximum expression is indicated.
(D) The maximum fold induction of the 29 IFNAR-independent genes in PAM-stimulated (black) and lipid A-stimulated Ifnar−/− (purple) BMDMs is shown (top), along with the percent expression of these genes in PAM-stimulated (black), lipid A-stimulated Ifnar−/− (purple), and lipid A-stimulated Trif−/− (orange) BMDMs relative to WT BMDMs stimulated with lipid A (bottom). IFNAR-independent genes were defined as those induced >10-fold and expressed >3 RPKM in the absence of IFNAR signaling, or expressed at greater than 50% of WT in Ifnar−/− BMDMs stimulated with lipid A or WT BMDMs stimulated with PAM.
(E) A scatterplot comparing the maximum RPKMs in PAM-stimulated BMDMs (y-axis) and lipid A-stimulated BMDMs (x-axis) for PRGs (blue) and the IFNAR-independent SRGs (red) is shown.
(F) Ingenuity Pathway Analysis was used to identify the top functional annotations for PRGs and the IFNAR-dependent and -independent SRGs.
(G) The IFNAR-independent genes involved in the proliferation, differentiation, and activation of T lymphocytes (Ingenuity Pathway Analysis) are colored based on their fold induction in Ifnar−/− BMDMs.

