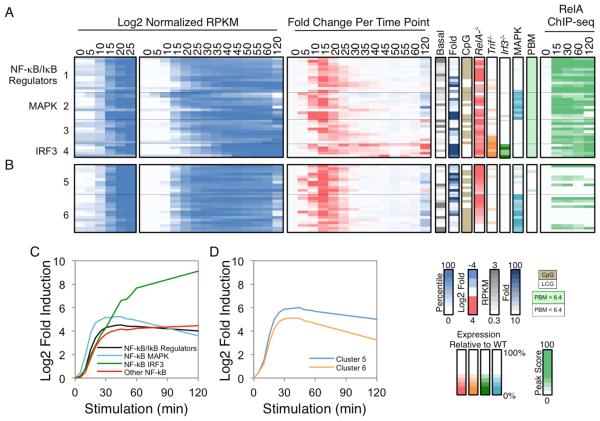
Figure 5. Kinetic and Functional Analysis of Putative NF−κB Target Genes.
(A) The 37 PRGs containing strong NF−κB promoter motifs and RelA ChIP-seq promoter peaks were grouped into four categories: those that encode NF-κB/IκB family members and regulators (group 1), those that exhibit either MAPK or IRF3 dependence (groups 2 and 4), and the remaining genes (group 3). Normalized expression values from 0-25 min (left panel) and 0-120 min (second panel), and the fold change relative to the previous time point (third panel) are shown. To the right of the heatmaps, the basal expression values, fold induction magnitudes, promoter CpG contents, and expression values in Rela−/−, Trif−/−, Irf3−/−, and MAPK-inhibited BMDMs are shown. The presence of a p50:RelA motif based on PBM datasets and the RelA ChIP-seq binding peak scores are indicated in the far right panels. See also Figure S4.
(B) Examples of PRGs that exhibited similar activation kinetics and/or RelA dependence to the 37 genes with strong NF−κB motifs and ChIP-seq peaks are shown. See also Figure S4.
(C) The average activation kinetics of the NF-κB subgroups is shown as log2 fold inductions relative to basal during the 120-min lipid A treatment period.
(D) The average activation kinetics of the two additional clusters from Figure 5B (Cluster 5 and 6) are shown.

