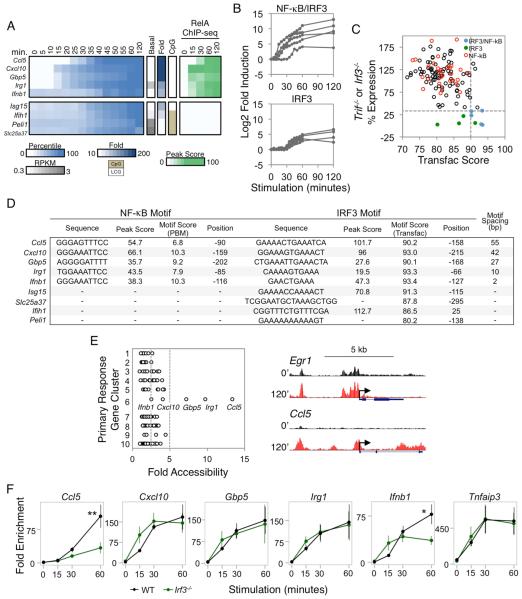
Figure 6. Analysis of IRF3 Target Genes.
(A) PRGs exhibiting IRF3 dependence (<33% expression in both Irf3−/− and Trif−/− macrophages) were separated based on the presence or absence of strong NF-κB promoter motifs and RelA ChIP-seq peaks. Colors indicate the percentile of the relative expression. Also shown are the basal RPKM, fold induction magnitude, and promoter CpG content. The rightmost heatmap indicates the RelA ChIP-seq binding peak scores.
(B) The fold induction for each IRF3-dependent gene is shown over the 2-hr time period, grouped based on their additional requirement for NF-κB.
(C) For each PRG, the higher maximum percent expression from either Trif−/− or Irf3−/− BMDMs (y-axis) was assessed against the best scoring IRF3 motif (x-axis) within the promoter based on the IRF Transfac PWM. The five IRF3/NF-κB genes are shown in blue, and the four IRF3 genes are shown in green. The PRGs containing strong NF-κB promoter motifs and RelA ChIP-seq peaks are shown in red. The horizontal dashed line indicates the expression threshold (33%), and the vertical dashed line indicates the Transfac threshold (90).
(D) For each IRF3-dependent gene, the IRF3 and RelA:p50 binding sites (for the IRF3/NF-κB groups of genes) were identified. The spacing between the NF-κB and IRF3 motifs is indicated at the right. The strengths of the κB motifs are represented by PBM Z scores, and the strengths of the IRF motifs are represented by PWM Transfac scores. For the four genes lacking NF-κB motifs, the best IRF promoter motif is shown.
(E) Left: The fold increase in ATAC-seq RPM at gene promoters (x-axis) is shown according to the PRG clusters 1-10 (y-axis) where the cluster designations denote 1:SRF, 2:MAPK, 3:MAPK/NF-κB, 4:NF-κB/Iκβ regulator, 5:NF-κB/Other, 6:NF-κB/IRF3, 7:NF-κB/Enhancer, 8:TRIF, 9:IRF3, 10:Unknown (see also Figure S6). The vertical dashed lines indicate the 2.5- and 5-fold cutoffs. Right: UCSC Genome Browser tracks of chromatin accessibility in resting and 120-min stimulated BMDMs at the promoters of two genes from different gene clusters are shown.
(F) RelA ChIP-qPCR was performed using WT and Irf3−/− BMDMs stimulated with lipid A. The relative enrichment of RelA binding was normalized to a negative control region. The RelA binding kinetics at the promoters of the 5 NF-κB/IRF3 genes were compared to the Tnfaip3 promoter as a control (far right). The data shown represent an average of 3 biological replicates. Error bars indicate the standard error. ** P <0.01; * P <0.05.

