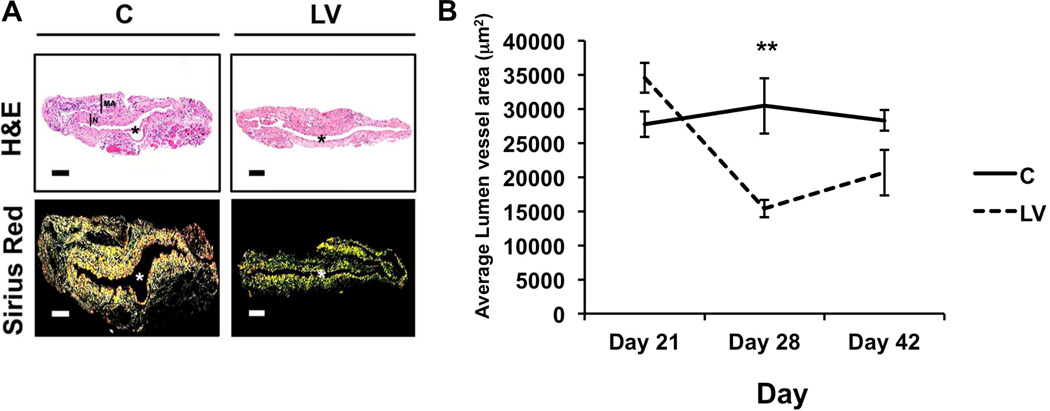
Figure 3. Hematoxylin and eosin (H and E) with Picrosirius red staining of the LV-shRNA-Vegf-A transduced vessels shows increased lumen vessel area with decreased collagen expression.
Representative sections after Hematoxylin and eosin (H and E) staining and Picrosirius red staining at the venous stenosis of the LV-shRNA-Vegf-A (LV) and scrambled-VEGF-A (C) transduced vessels at day 21 after the first administration. Pooled data for the LV-shRNA-Vegf-A and control shRNA groups each at day 21, 28, and 42 is shown in B. Semiquantitative analysis for lumen vessel area (B) shows an increase in the average lumen vessel area of LV transduced vessels when compared to C at day 21 after the first administration. Two-way ANOVA followed by Student t-test with post hoc Bonferroni’s correction was performed. Significant difference from control value was indicated by **P<0.01. Each bar shows mean ± SEM of 4–6 animals per group (A–B).

