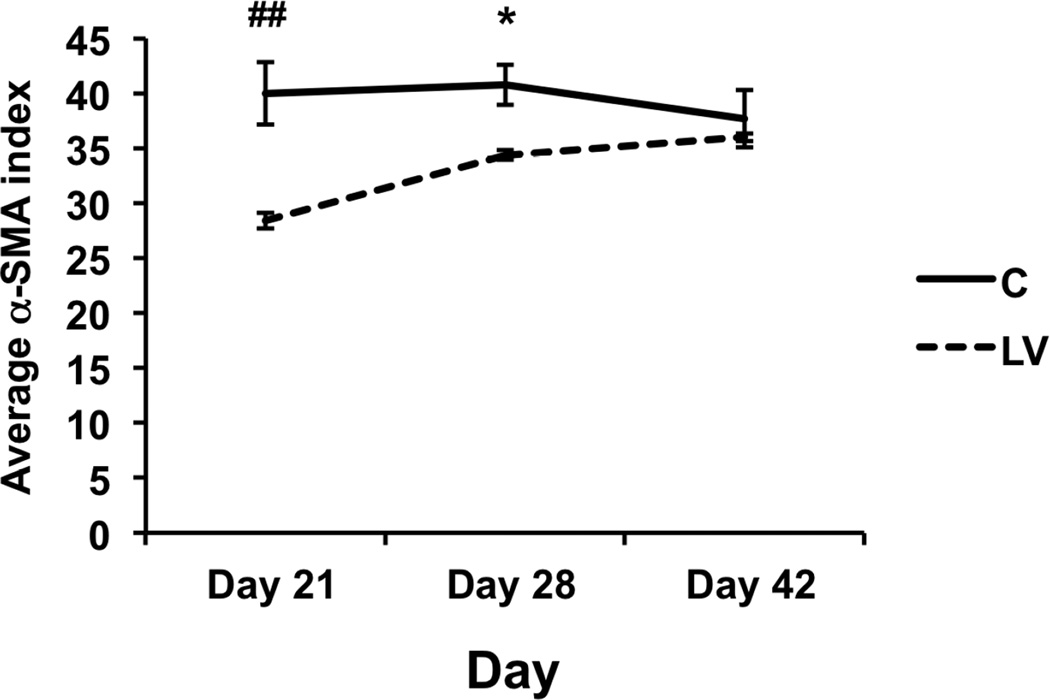
Figure 5. Smooth muscle cell index is reduced in LV-shRNA-Vegf-A transduced vessels when compared to controls at day 21.
Pooled data for the LV-shRNA-Vegf-A and control shRNA groups each at day 21, 28, and 42 is shown. This demonstrates a significant reduction in average α-SMA index in the LV transduced vessels when compared to C at day 21. Two-way ANOVA followed by Student t-test with post hoc Bonferroni’s correction was performed. Significant difference from control value was indicated by *P<0.05 or ##P<0.0001. Each bar shows mean ± SEM of 4–6 animals per group.

