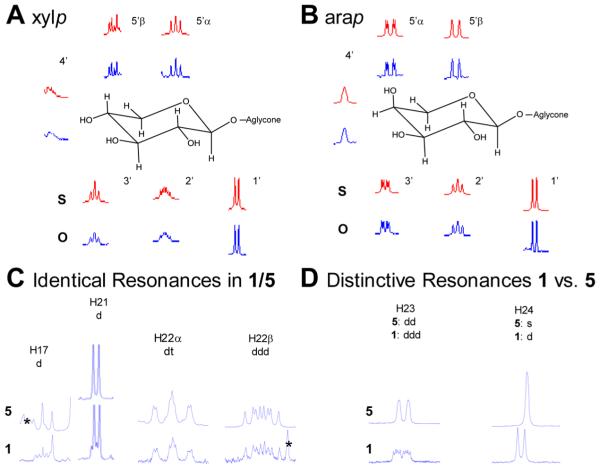
Figure 1.
HiFSA spin simulation analysis of typical saccharides (A, B) and the side chain substructure of 1 (C, D). HiFSA spin simulation of the 1H NMR signals of the (A) β-d-xylopyranoside (xylp) spin system in 4 and (B) α-l-arabinopyranose (arap) spin system in 2. Top signals (in red marked with “S”) represent the simulated and the bottom signals (in blue marked with “O”) the experimentally observed signals for 2. (C, D) Comparison of the 1H NMR signals for 1 (top) and 5 (bottom) in rings E and F, respectively. The signal for H-20 is not displayed, as it could not be analyzed due to extensive signal overlap. Signals marked with asterisks (*) belong to peaks of other spin systems.

