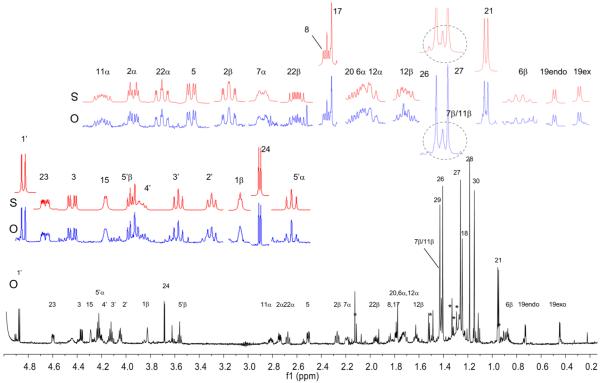
Figure 2.
1H NMR spectrum (900 MHz) of 1 in pyridine-d5. This sample contained 22–28% of an unidentified structurally related impurity, calculated from the signals of H-1′ (29%: 71%) and H-19-endo (22%:78%). Impurity peaks are denoted by *. Original spectra are denoted with an “O” (blue), and the corresponding HiFSA simulations are marked with an “S” (red).

