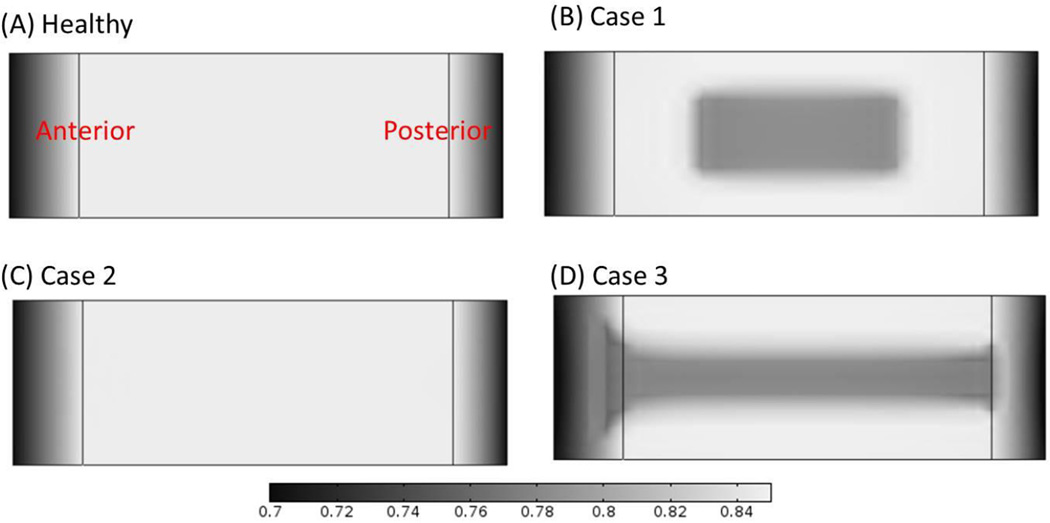
Figure 8.
Comparison of the water content distributions on the mid-sagittal plane (A) in the healthy disc with reference values of nutrition level, (B) in Case 1 where nutritional level was decreased in CEP-NP pathway only, (C) in Case 2 where nutrition level was decreased in AF pathway only, and (D) in Case 3 where nutrition level was decreased in both pathways. The results shown in (B–D) are water content distributions at 10 years after cell density reached steady state as nutrition level reduced to 15% of the corresponding reference values.

