Fig. 2.

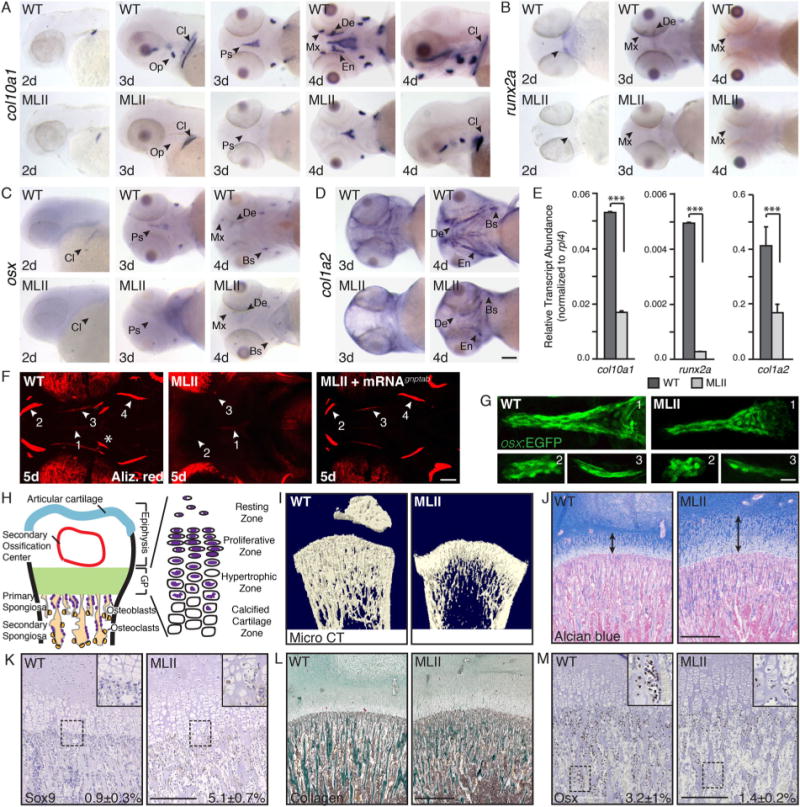
MLII animals exhibit reduced osteogenesis of dermal bones. ISH of (A) col10a1, (B) runx2a, (C) osx, and (D) col1a2 show reduced osteogenesis in MLII zebrafish. n = 100 embryos/condition. Scale bar = 100 μm. Bs = brachiostegal ray; Cl = cleithrum; De = dentary; En = entopterygoid; Mx = maxilla; Op = opercle; Ps = parasphenoid; (E) qPCR of embryonic heads 4 dpf. n = 30 embryos/sample, 4 experiments. ***p < 0.001. (F) Live Alizarin red–stained 5 dpf WT, MLII, and MLII+gnptab mRNA embryos. Arrows denote regions of interest (ROI 1–4, where 1 = Ps, 2 = Mx/De, 3 = En, 4 = Bs). Asterisks show endochondral bone collars. n = 30 embryos. Scale bar = 50 μm. (G) Confocal analyses of osx(sp7):EGFP embryos. Regions (ROI 1–3, where 1 = Ps, 2 = Mx, 3 = En) shown. n = 30 embryos/condition, 3 experiments. Scale bar = 20 μm. (H) Schematic of growing mammalian femur. (I) Distal femurs of MLII kittens (n = 3, aged 0 to 2 months) and WT littermates (n = 6) analyzed by X-ray micro–CT scan show delayed ossification and osteopenia. Femur sections stained with Alcian blue (J) or for Sox9 (K) show widened growth plates (arrows) and increased Sox9 expression and cartilaginous matrix in primary spongiosa. Femur sections stained with Masson’s trichrome (L) or for Osx (M) show reduced Osx and collagen in primary spongiosa. Representative sections from 15-day-old animals. For J–M, WT n = 4–7, MLII n = 2–3 different kittens. The percent values listed equal the number of cells stained positively for a given marker. (J, L) Scale bar = 1 mm. (K, M) Scale bar = 300 μm. Higher power images of K and M in Supplemental F1.
