Fig. 5.

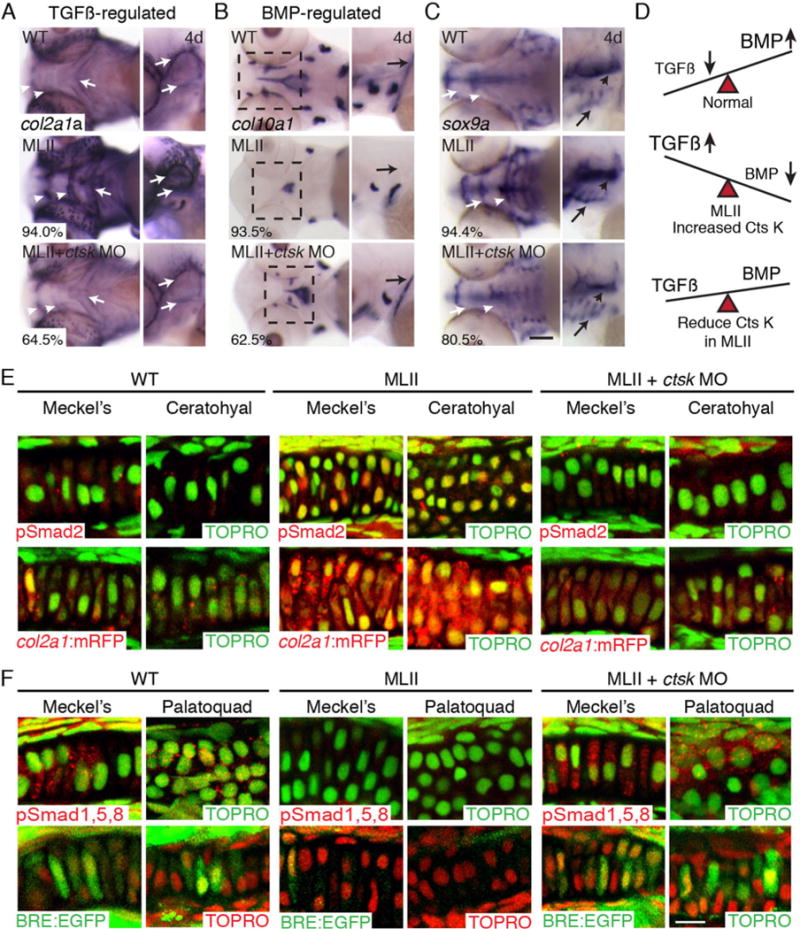
ctsk inhibition improves altered TGFß and BMP Smad activation in zebrafish. ISH of (A) TGFß gene target col2a1a, (B) BMP target gene col10a1a, and (C) sox9a. The percent values shown indicate the number of embryos with the phenotype pictured. n = 100 embryos. (D) Schematic showing idea that TGFß signals decline and BMP signals increase as normal cartilage matures. This balance is disrupted in MII but restored with ctsk reduction. (E) Immunohistochemistry of pSmad2 (red) in WT, MLII, and ctsk-inhibited MLII (upper row). Analyses in col2a1a:mRFP (red) reporter line (lower row). TOPRO+ nuclei green. (F) Immunohistochemistry of pSmad1,5,8 (red) in WT, MLII, and ctsk-inhibited MLII embryos (upper row). Analyses in BMP reporter line BRE:EGFP (green; lower row). TOPRO+ nuclei are green in upper panels and red in lower panels. Ctsk inhibition restored WT levels of pSmad2 and pSmad1,5,8 activation in >60% and >50% of embryos, respectively. n = 30–50 embryos, 3 experiments. Scale bar = 10 μm.
