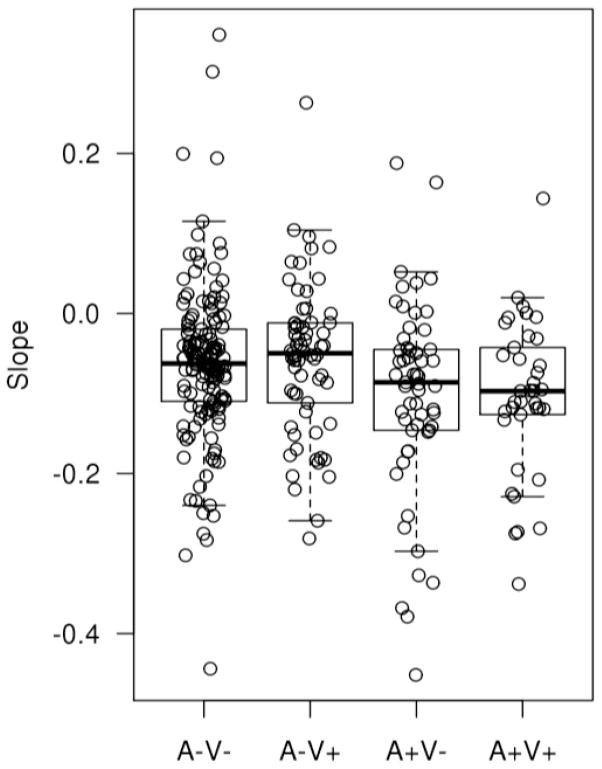
Figure 3.
Slopes of Hippocampal volume on serial MR scans seen in cognitively normal individuals classified by amyloid and vascular positivity and negativity at baseline. Note that the mean values are all negative indicating some loss in all 4 groups. Subjects with A+V− and A+V+ had significantly greater decline in hippocampal volume in comparison to both the A−V− and AV+ groups.

