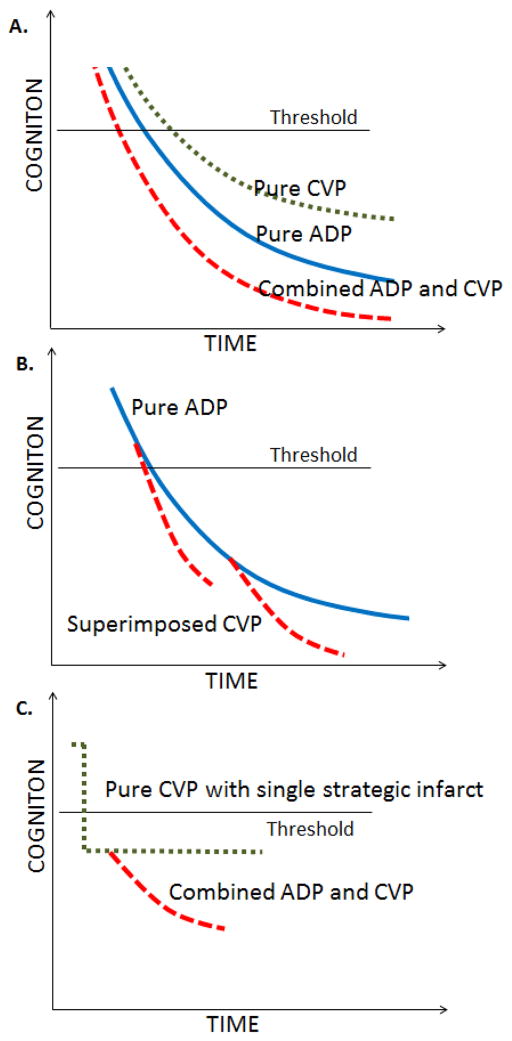
Figure 4.
Typical cognitive decline trajectories that may be expected in pure vs. multi-etiology dementias as a function of time. Panel A illustrates trajectories when the evolution of CVP and ADP are nearly at the same time. Panel B illustrates trajectories when CVP starts at a later time after the onset of ADP. Panel C illustrates trajectory where the event of a single strategic infarct (pure CVP) is followed shortly by the onset of ADP. The threshold shown in the figure indicates the cognitive threshold for dementia detection.

