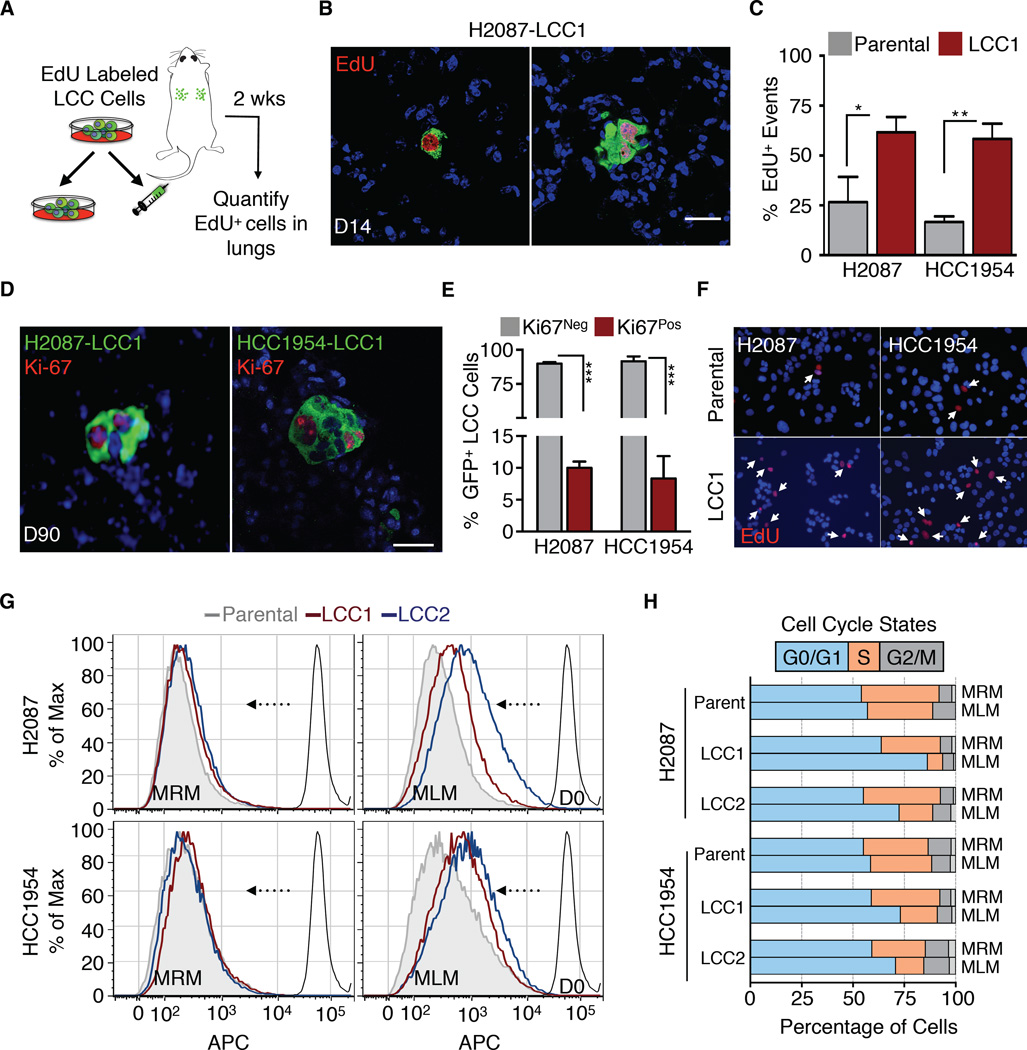
Figure 2. LCC cells adopt a slow-cycling state in vitro and in vivo.
(A) Experimental design for EdU pulse-chase experiment.
(B) Immunofluorescence images of double-positive GFP+/EdU+ LCC cells (green, red) in lungs.
(C) Quantification of double-positive EdU+/GFP+ LCC cells versus parental counterparts in lungs harvested 2 weeks post-injection. Data are mean percentage of EdU+ cells per lung ± S.E.M. N = 3 mice per group, scoring representative serial sections of the entire lung for each mouse. P < 0.05 (*), P <0.01 (**), Mann-Whitney Test.
(D) Representative immunofluorescence images of proliferating Ki-67+ (red) H2087-LCC1 (in lung) and HCC1954-LCC1 cells (in brain) 3 months post-injection.
(E) Quantification of LCC cells from Figure 2D. Data are percentage of total cells that are Ki67+ per organ ± S.E.M. N = 5 per group, scoring representative serial sections of the entire organ of each mouse. P < 0.001 (***), Student’s t-test.
(F) Micrographs of the indicated cell lines in culture 4 days post EdU labeling. White arrows point to cells retaining EdU label.
(G) Retention of eFluor670 dye by indicated cell lines after 6 days in MRM or MLM culture conditions.
(H) Cell cycle analysis of the indicated cell lines by BrdU/APC after 3 days in MRM or MLM culture conditions.
Scale bars, 10μm (B and D), and 15μm (E). See also Figure S2.

