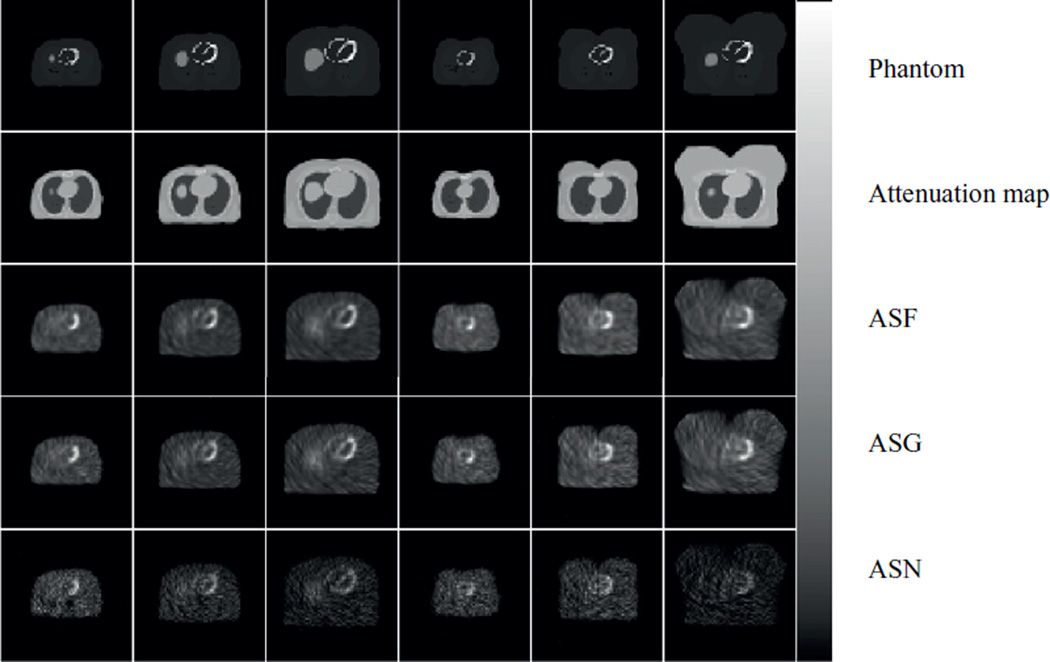
Figure 5.
Sample transaxial images containing the center of mass of the heart centroid for different phantoms and the corresponding attenuation maps (rows 1 and 2). Rows 3 to 5 show the corresponding reconstructed image slices using collimator C2 and ASF, ASG and ASN compensation methods after 36 updates.

