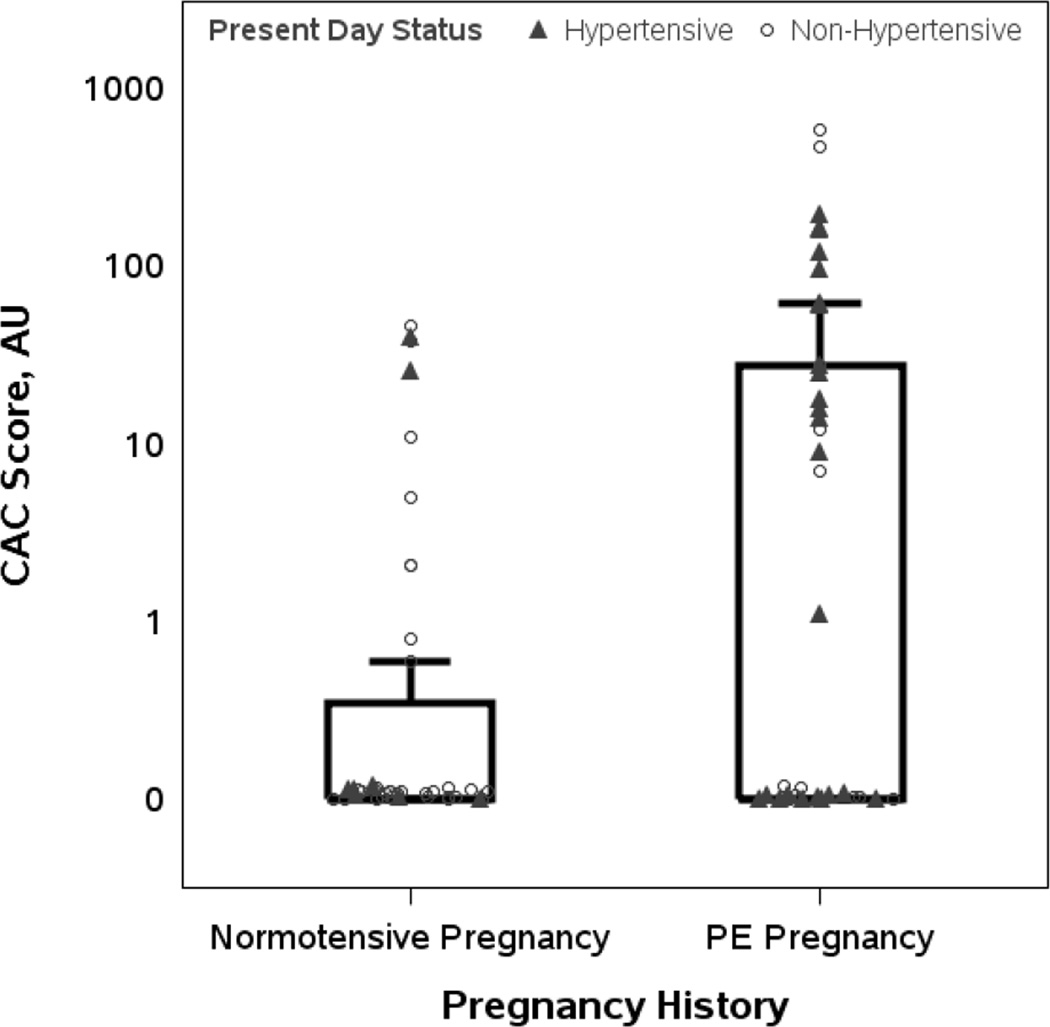
Figure 1. Distribution of CAC scores in subjects with and without a history of preeclampsia stratified by present day hypertension.
Individual CAC scores (normotensive pregnancy, n=40; preeclamptic pregnancy, n=39) are plotted on a logarithmic scale. Triangles represent women with current hypertension and circles indicate those without current hypertension. The interquartile range (i.e., 25th to 75th percentiles) is indicated by the box, with the upper whisker the largest non-outlier. The mean (± SD) and median (25th–75th percentiles) CAC score were 4.3 (±11.7) AU and 0.0 (0.0, 0.3) AU, respectively, in women with a history of normotensive pregnancy and 54.1 (±126.3) and 0.0 (0.0, 28.0) AU, respectively, in women with a history of preeclampsia (P = 0.007). The number of women with a CAC score > 0 was 10 (25%) in the normotensive pregnancy group, compared to 19 (49%) in the preeclampsia group (P = 0.029). The frequency of CAC score > 50 AU was greater in the preeclampsia group (23% v. 0%, P=0.001).

