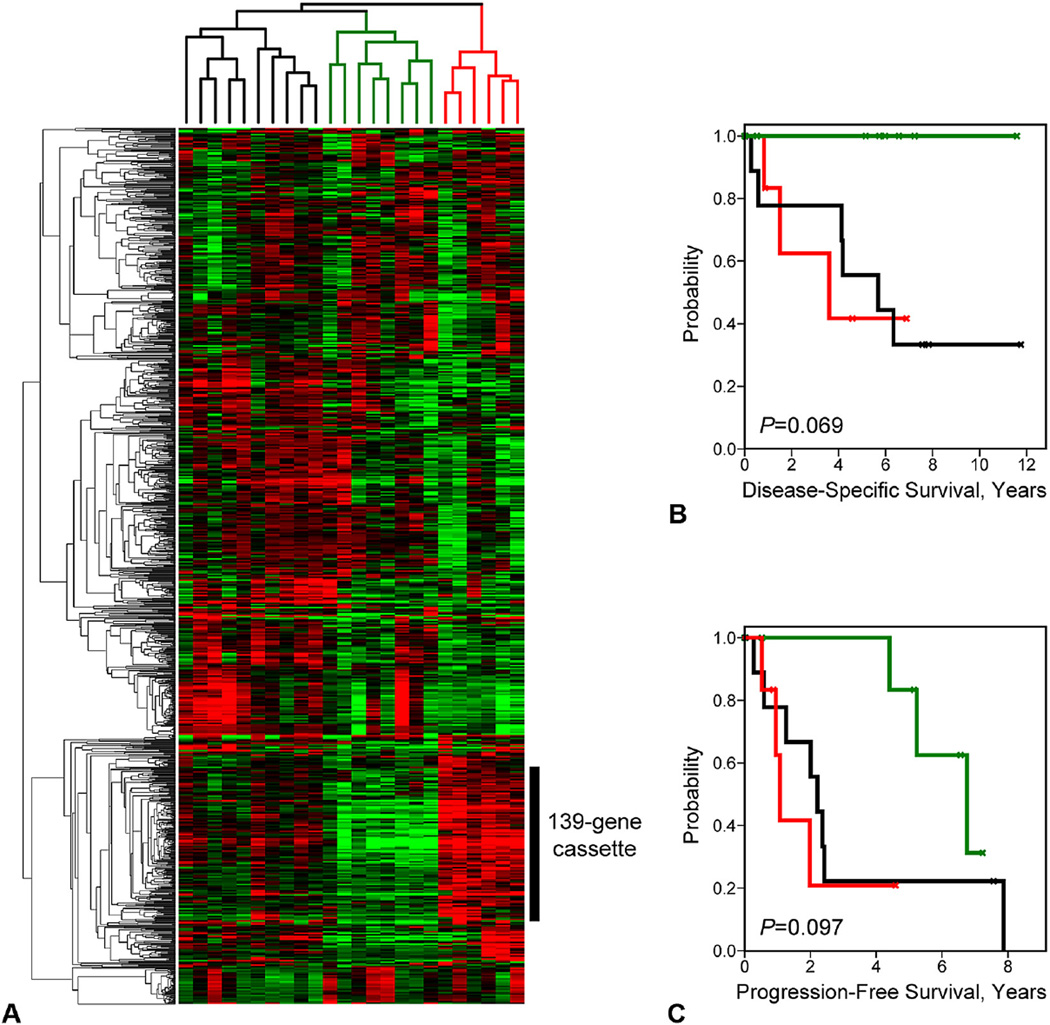
Figure 2.
Unsupervised hierarchical clustering discerns prognostic tumor subtypes. (A) Heatmap of clustered gene expression patterns (rows) and tumor expression profiles (columns) is shown. Red indicates above-mean expression; green indicates below-mean expression. Degree of color saturation reflects the magnitude of gene expression. (B, C) Kaplan-Meier survival curves corresponding by color to the tumor branches designated in (A) are shown for (B) disease-specific survival and (C) progression-free survival.

