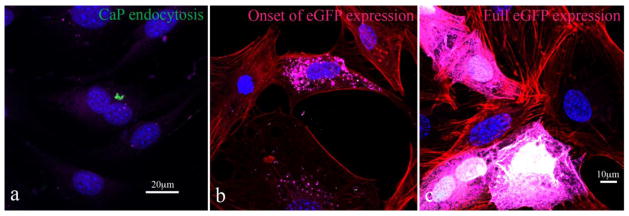
Fig. 9.
Confocal optical images of MC3T3-E1 cells subjected to a CaP-pDNA-citrate nanoparticle treatment (1μg of pDNA per well) showing the timeline of transfection events: (a) CaP particles (green) are endocytosed and are seen in the vicinity of the nucleus (blue), at which stage they have already delivered their plasmid payload; (b) MC3T3-E1 cells are now transfected and the expression of eGFP (purple) has begun; (c) the expression of eGFP within the transfected MC3T3-E1 cells is now at its maximum and the transfected cells glow throughout their entire volume. The images show CaP-pDNA particles stained in green, f-actin stained in red, eGFP stained in purple and the cell nuclei stained in blue.

