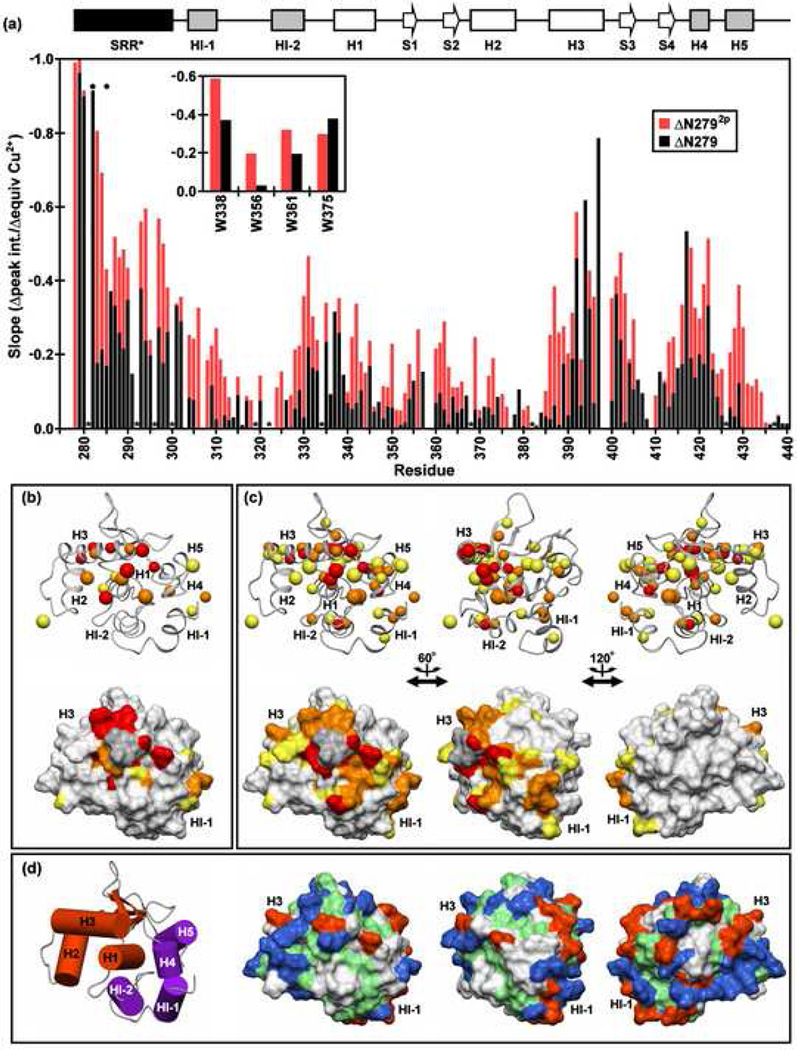
Fig. 7.
The SRR* is localized to a region of the regulatable unit spanning from the inhibitory helix HI-1 to the DNA recognition helix H3, and phosphorylation enhances this localization. (a) Paramagnetic relaxation enhancements (PRE) observed for the backbone amides and tryptophan indoles (inset) of ΔN279 (black) and ΔN2792p (red) in 500 mM NaCl, as reflected by a linear regression analysis of the plots of 1H-15N HSQC signal intensities versus equivalents Cu2+ added. Resonances which completely broaden upon addition of ~ 1 equivalent CuSO4 have slopes approaching −1.0. The absence of a bar indicates that data could not be unambiguously measured for a given residue due to spectral overlap or a weak signal. Dark circles and asterisks represent the phosphoacceptor serines and prolines, respectively. The PRE slope values of (b) ΔN279 and (c) ΔN2792p (rotated about the vertical axis as indicated) are mapped onto the ΔN301 structure. The upper and lower views are the ribbon and corresponding surface diagrams, respectively. The smaller balls represent backbone amides, while the larger balls indicate either Asn/Gln sidechain NH2 or aliphatic methyl groups. The color scheme is red, slope < −0.4 (i.e. largest PRE); orange, −0.4 ↔ −0.325; yellow, −0.325 ↔ −0.25. Residues for which data were unavailable are shaded in grey. (d) Insights into enhanced DNA binding inhibition may be derived from the surface diagram of ΔN301, showing negatively-charged (Asp, Glu; red), positively-charged (Arg, Lys, His; blue), hydrophobic (green), and neutral polar/Gly (white) residues. The orientations match those of panel (c). A cylinder model of the regulatable unit, colored and positioned as in Fig. 1e, is provided for orientation of the leftmost structures in panels in (b–d).

