. 2016 Mar 22;17(1):35–44. doi: 10.4142/jvs.2016.17.1.35

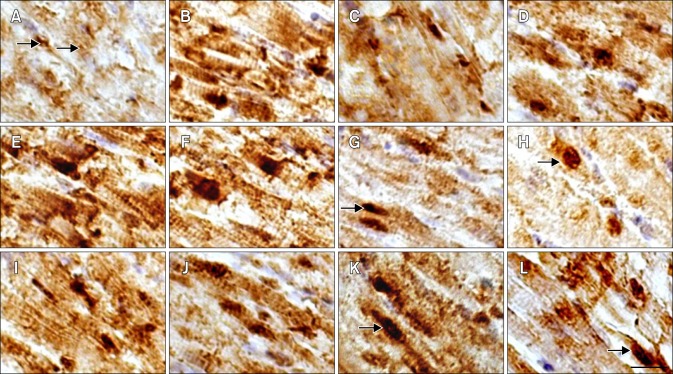
Fig. 3. Distribution Distribution of Hsp90 in the myocardial cells of tested chickens. (A–D) HS group. (I–L) ASA group. (E–H) ASA+HS group. (A) At 0 h of HS, Hsp90 was constitutively expressed in the nucleus and cytoplasm (arrow). (B) After 2 h, Hsp90 expression increased obviously. (C) After 5 h, the maximum intensity of Hsp90 signal weakened. (D) After 24 h, Hsp90 signal showed the second peak. (E) Before HS (0 h), cellular Hsp90 signal was extremely strong. (F) After 2 h of HS, extremely high Hsp90 expression was still observed. (G) After 5 h, cytoplasmic Hsp90 signal decreased while the signal in the nucleus did not (arrow). (H) After 24 h, Hsp90 signal was still present in the nucleus (arrow). (I) At 0 h of test, strong Hsp90 signal was detected in both the nucleus and cytoplasm. (J) The Hsp90 density decreased after 2 h. (K) Hsp90 level rebounded after 5 h, especially in the nucleus (arrow). (L) After 24 h, Hsp90 expression persisted in the cytoplasm and nucleus (arrow). Immunohistochemical staining with hematoxylin counterstain. Scale bar =10 µm.

Fig. 3