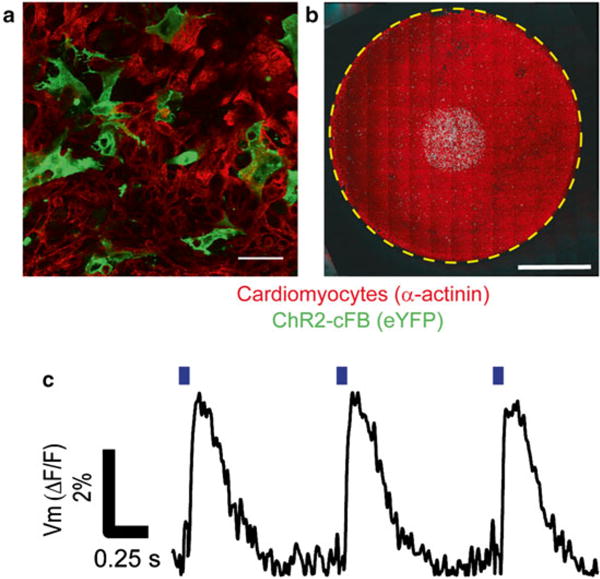
Fig. 4.

Co-culture of ChR2-cFB and cardiomyocytes and confirmation of opsin functionality. (a) Fluorescent images of diffuse plating. Scale bar is 50 μm. (b) Panoramic macroscopic fluorescent image of patterned ChR-cFB cluster surrounded and covered by cardiomyocytes. Scale bar is 4 mm. (c) Optical activation of ChR2-cFB leads to excitation in cardiomyocytes. Blue bars indicate time of 470 nm light pulse. Optical stimulation was 10-ms pulse at 0.31 mW/mm2. Action potentials were acquired via Di4-ANBDQBS optically at 390 frames/s
