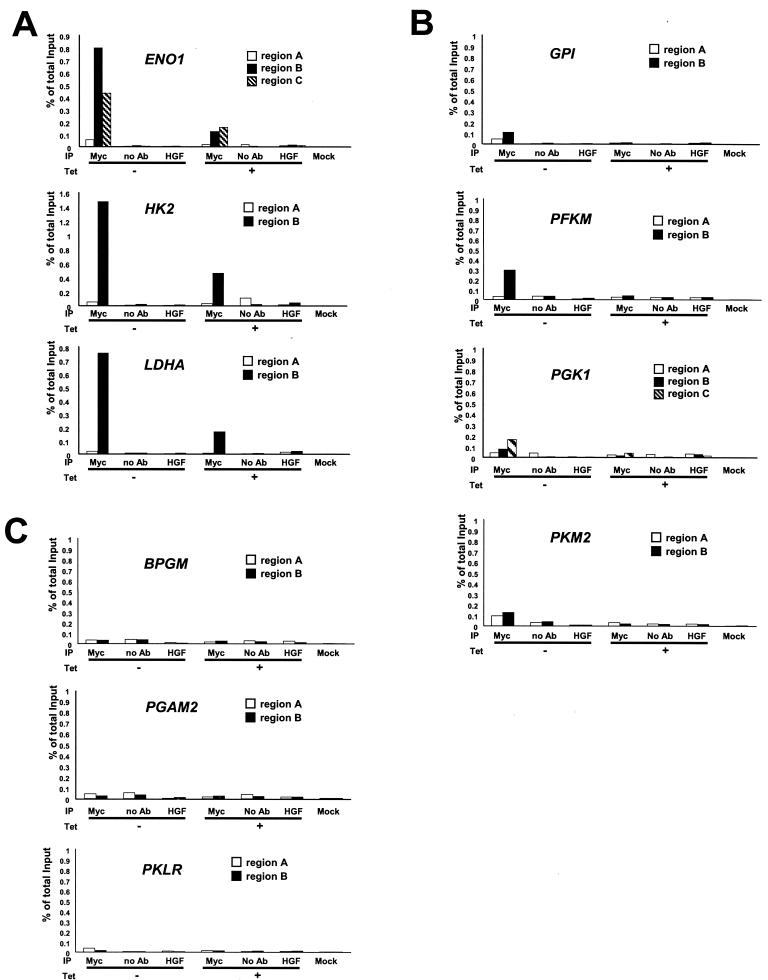
FIG. 5.
ChIP assay of glycolytic genes in the P493-6 cell system. Glycolytic genes displaying strong Myc binding (A), moderate or weak Myc binding (B), or no Myc binding (C) are shown. Labeled regions (as shown in Fig. 1; region A, B, or C) of each gene were quantitatively amplified by real-time PCR. PCR was performed on the fragmented chromatin precipitated from P493-6 cells left untreated (−) or treated (+) with tetracycline (Tet) for 72 h with anti-Myc or HGF, without antibody (no Ab), or mock control samples as indicated at the bottom of the graph. The white bars represent the percentage of total input of control regions (region A). The black and hatched bars represent the percentage of total input of the chromatin regions that contain conserved canonical E boxes (ENO1, HK2, and LDHA) or nonconserved canonical E boxes (BPGM, GPI, PFKM, PGAM2, PGK1, and PKM2).

