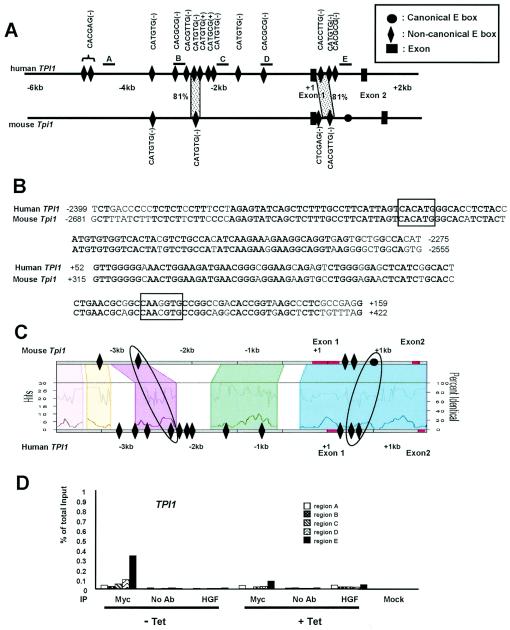
FIG. 8.
Phylogenetic footprinting analysis and scanning ChIP assay of TPI1. (A) Noncanonical E boxes and exons are indicated in the human and mouse genomic sequences. The lead (+) or complement (−) sequences of noncanonical E boxes are also indicated. One canonical E box in mouse intron 1 is indicated as a black circle. The dotted areas represent the conservation of the noncanonical E box and its extended flanking region with more than 65% sequence identity for longer than 30 bp. The percentage of sequence identity is also shown. The regions that are amplified for the scanning ChIP assay are indicated as the lines above the human gene and labeled A to E. (B) Sequence alignments of the conserved E box and its extended flanking regions are shown. Noncanonical E boxes are boxed in each sequence alignment. Conserved nucleotides are shown in bold type. (C) Trafac analysis (regulogram) of human and mouse genomic sequences. (D) Scanning ChIP assay of human TPI1 in P493-6 cell system. P493-6 cells were either not treated (− Tet) or treated with tetracycline (+ Tet) for 72 h. ChIP was performed with anti-Myc or HGF, without antibody (no Ab), or mock control samples as indicated at the bottom of the graph.

