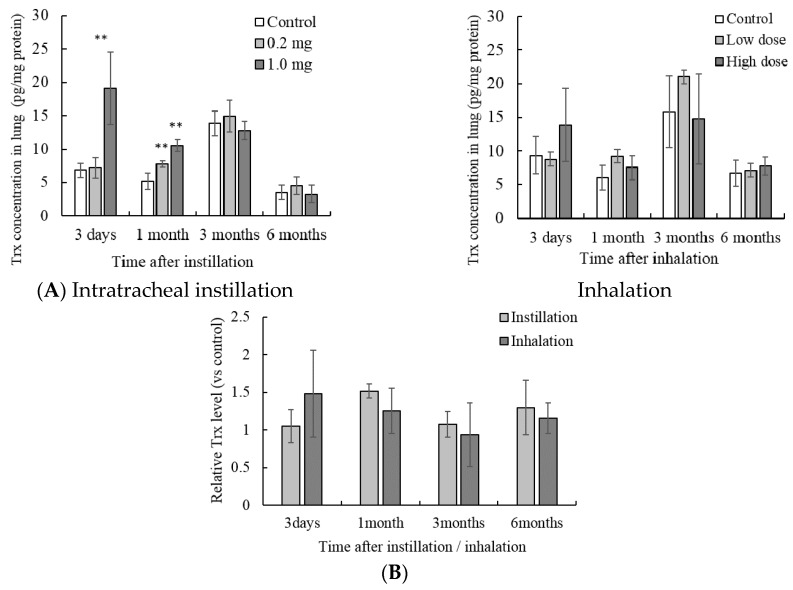
Figure 4.
Influence of NiO nanoparticle exposure on the concentration of thioredoxin (Trx) in lung tissue. (A) The concentration of Trx in the lung after intratracheal instillation and inhalation. The Trx concentration was measured using ELISA. Values are mean ± SE (n = 5). Significant differences versus control group are indicated in the figure (ANOVA, Dunnet). ** p < 0.01; (B) Comparison of 0.2 mg intratracheal instillation and high dose inhalation. The data show the relative level of the Trx protein concentration against each control group.

