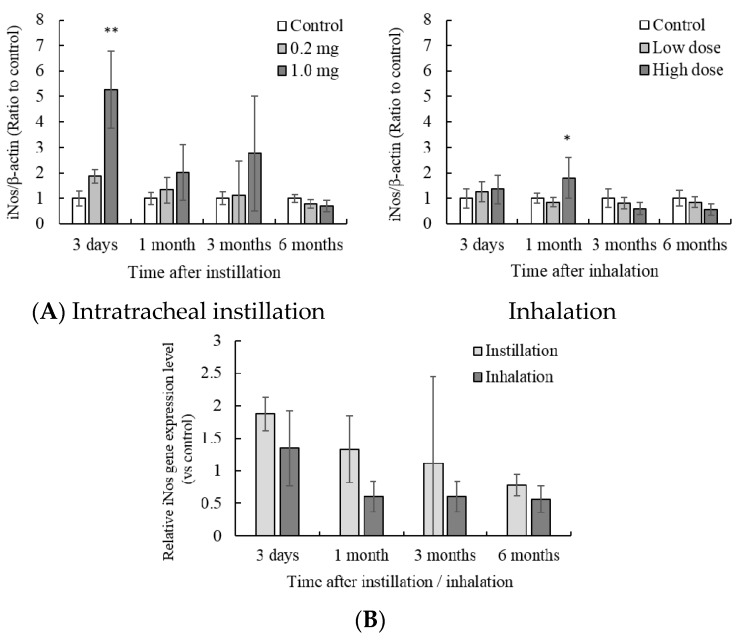
Figure 5.
Influence of NiO nanoparticle exposure on the gene expression of iNos in the lung. (A) iNos gene expression in the lung after intratracheal instillation and inhalation. The gene expression of iNos was determined by real-time PCR. Values are mean ± SE (n = 5). Significant differences versus control group are indicated in the figure (ANOVA, Dunnet). ** p < 0.01, * p < 0.05; (B) Comparison of 0.2 mg intratracheal instillation and high dose inhalation.

