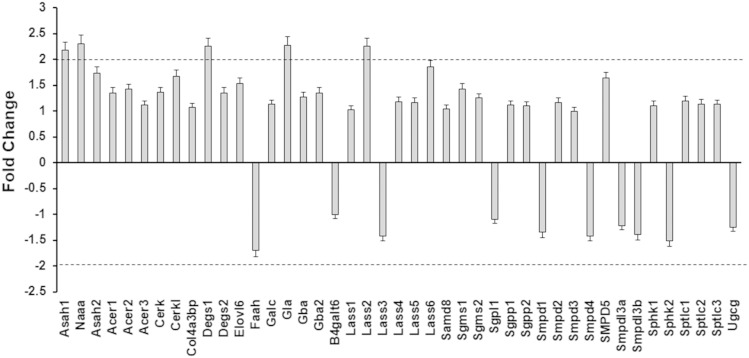
Fig. 3.
Sphingolipid-metabolizing enzyme’s gene expression after induction of diabetes. Heart samples were prepared from control and diabetic mice. RNA was extracted and converted to cDNA for analysis by real-time PCR using a PCR array as described in the Materials and Methods. The data are presented as a fold change comparing diabetes to control and are the means of three independent experiments. The dashed line represents a 2-fold change.

