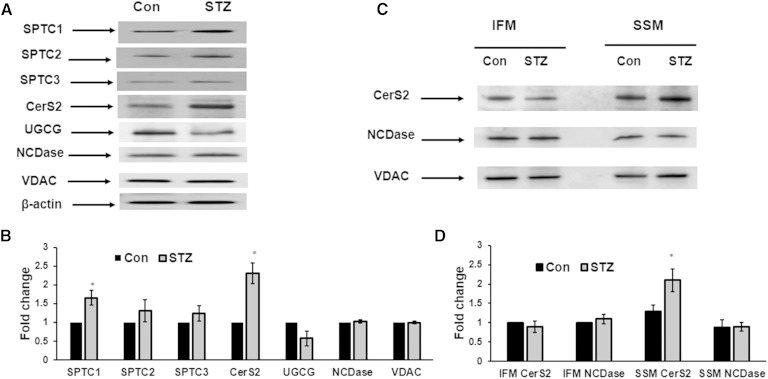
Fig. 4.
Effect of diabetes on the abundance of ceramide metabolizing enzymes in heart lysates (A, B) and isolated mitochondria (C, D). Western blots were performed by loading equal amounts of 30 μg of homogenate (A), or mitochondrial (SSM or IFM) protein per lane, except VDAC, which was assessed using protein loading of 15 μg per lane. A: Representative Western blot of heart lysates. B: Quantification of protein expression in heart lysates. Levels of respective proteins were normalized against β-actin and their expression in STZ animals relative to control was determined. Data are mean ± SE of three homogenate preparations; eight to ten mice were used for each preparation of homogenate. *P < 0.05. C: Representative Western blot of heart mitochondria. D: Quantification of protein expression in heart mitochondria. Levels of respective proteins were normalized against VDAC and their expression relative to IFM control was determined. Data are mean ± SE of three preparations; eight to ten mice were used for each preparation of mitochondria. *P < 0.05.

