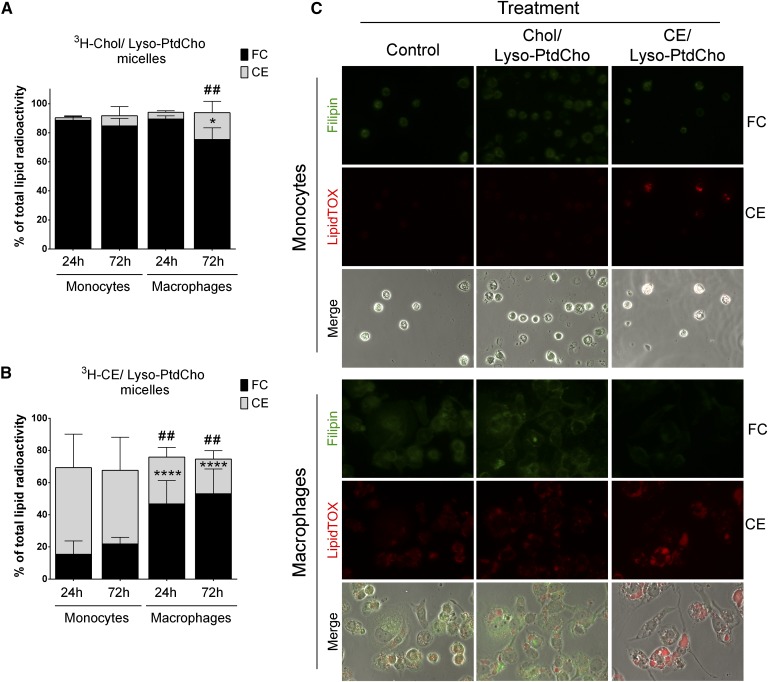
Fig. 2.
Analysis of cholesterol and CE metabolism in THP-1 monocytes and macrophages. A–B: Cholesterol and CE fractions after incubation with 3H-cholesterol (Chol)/lyso-PC (Lyso-PtdCho) (A) or 3H-CE/lyso-PC (B) micelles for the indicated times. Data are mean ± SD (n = 3, each condition in duplicate) and are expressed as percent of total radioactivity in the cell lipid fraction. Monocyte free cholesterol (FC) versus macrophage FC, * P < 0.05, **** P < 0.0001; monocyte CE versus macrophage CE, ## P < 0.01 (two-way ANOVA with Tukey’s posttest). C: FC and CE accumulation in THP-1 monocytes and macrophages after 72 h treatment with the indicated micelles. Filipin stain for unesterified cholesterol (FC, green) and LipidTOX for neutral lipid staining (CE, Red). Magnification ×40.

