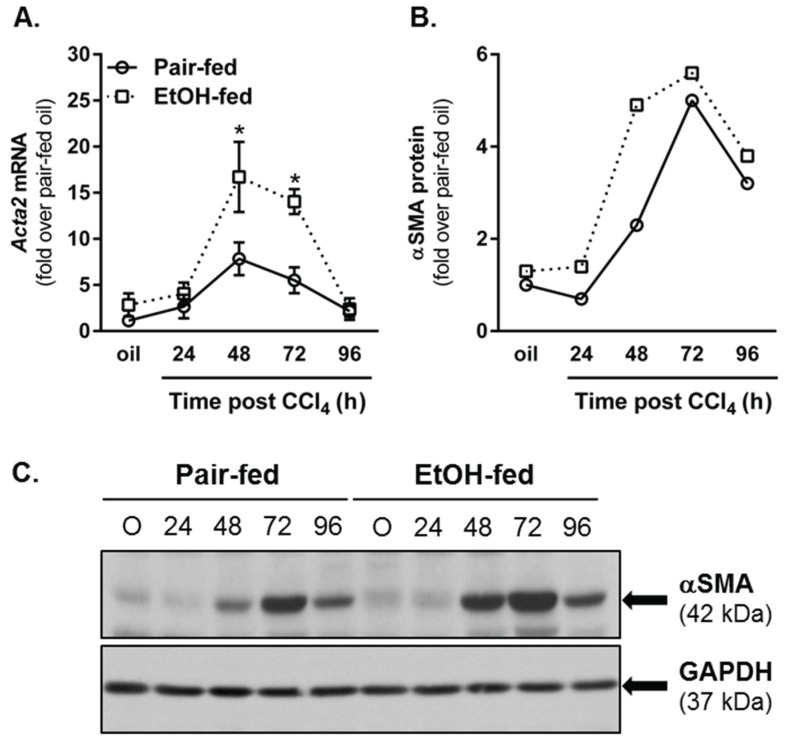
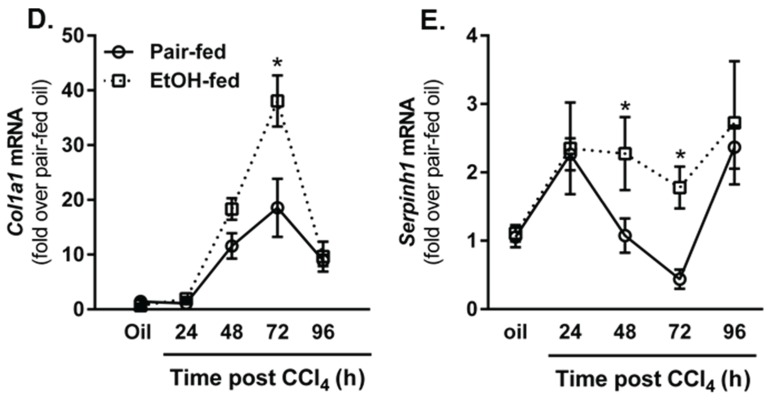
Figure 10.
Moderate ethanol feeding enhanced hepatic stellate cell (HSC) activation after acute CCl4 exposure. (A) Real time PCR was used to measure hepatic Acta2 transcript accumulation. Data are expressed as fold change over pair-fed, olive oil-exposed mice after normalization to 18S; (B) Semi-quantification of αSMA band density expressed as fold change of pair-fed, olive oil exposed mice after normalization to GAPDH as a loading control; (C) Representative αSMA immunoblot. Hepatic Col1a1 (D) and Serpinh1 (E) transcript accumulation were determined using real-time PCR. Data are expressed as fold change over pair-fed, olive oil-exposed mice after normalization to 18S. N = 4–8 mice per group. * p < 0.05.


