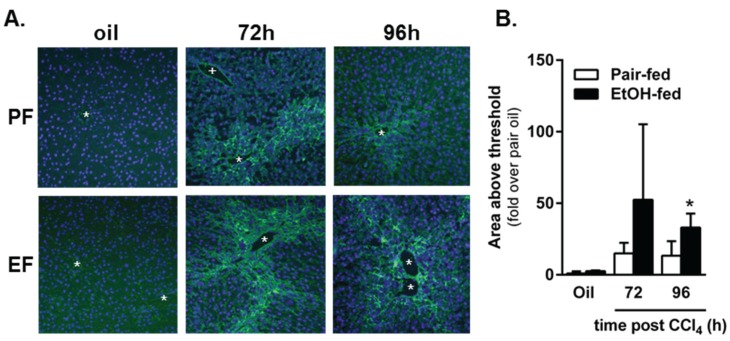
Figure 11.
Matrix metabolism was sustained by ethanol feeding to mice after acute CCl4 exposure. In situ zymography was used to determine area of gelatinase activity in frozen liver sections from pair- and ethanol-fed mice after CCl4 exposure. (A) Representative fluorescence microscopy images. The green fluorescence indicates area of gelatinase activity. The blue fluorescence (DAPI) was used as a nuclear counter stain. The asterisks denote location of central veins, while the plus sign (PF, 72 h only) denotes the location of a portal vein. Matrix metabolism occurs most robustly in the pericentral area where CCl4-induced liver injury and subsequent liver regeneration occurs; (B) Quantification of the area of fluorescence per 200× image as a fold change over pair-fed, olive oil-treated mice. PF = Pair-fed, EF = Ethanol-fed. N = 3–6 mice per group (CCl4). * (in B), p < 0.05.

