
Fig 4.
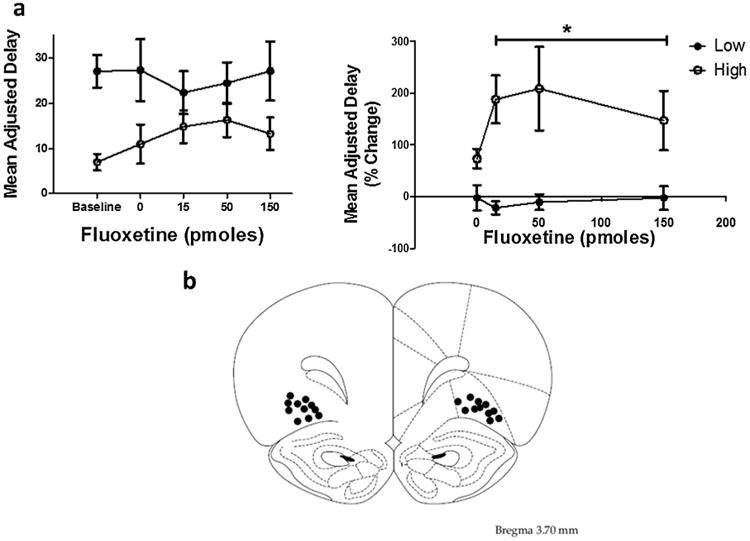
Panel a. Mean adjusted delay raw scores following OFC microinfusions of fluoxetine in high (n = 6) and low (n = 5) impulsive rats based on a median split (left). Mean (±SEM) adjusted delay scores following OFC microinfusions of fluoxetine expressed as a % change from baseline in high and low impulsive rats based on a median split (right). Note that high MAD scores indicate decreased impulsive choice.
*Represents significant overall drug effect in high impulsive rats (averaged across the three doses) compared to saline, p < 0.05.
Panel b. Diagram shows locations for bilateral intra-OFC cannula injection sites for rats that were included in the statistical analysis. One rat was excluded from the data analysis due to the probe placement being outside of OFC.