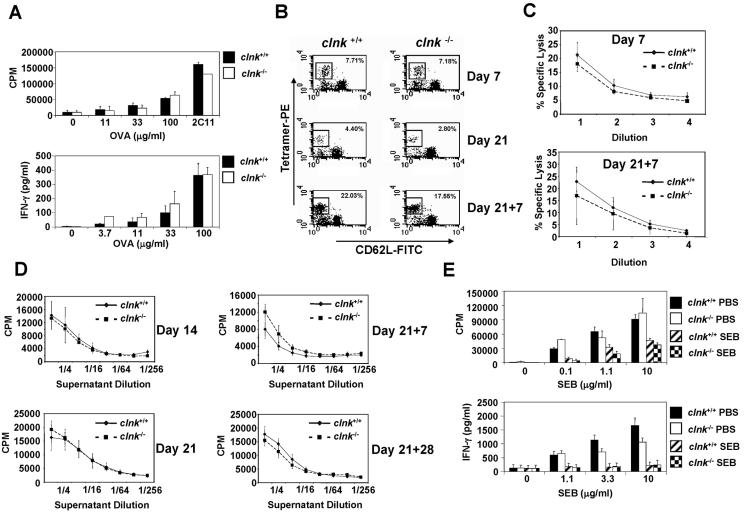
FIG. 3.
In vivo assays of T-cell functions. (A) T-cell memory. Mice were injected with ovalbumin (OVA) emulsified in CFA. Ten to fourteen weeks later, total spleen cells were stimulated with the indicated concentrations of OVA protein. Proliferation was assessed by measuring thymidine incorporation (top panel), whereas IFN-γ production was determined by ELISA (bottom panel). Control stimulation was performed by using soluble anti-CD3 MAb 145-2C11 (2C11) (3 μg per ml). Standard deviations are shown. (B) Antigen-specific anti-influenza virus T cells. Mice were infected with influenza virus as detailed in Materials and Methods. At the indicated times after primary (day 7 or day 21) or secondary (day 21 + 7) infection, MHC class I NP peptide tetramer-reactive CD8+ CD62Llo T cells (which represent antigen-specific effector T cells) were identified by flow cytometry. These results are representative of assays with three independent mice in each group. (C) Ex vivo cytotoxicity assay. Mice were infected as described in the legend for panel B. At the indicated times after primary (day 7) or secondary (day 21 + 7) infection, purified T cells were incubated in serial threefold dilutions (abscissa) with 51Cr-labeled EL-4 cells prepulsed with NP peptide. 51Cr release was measured and is presented as the percentage of maximal release. Standard deviations are shown. These results are representative of assays with three independent mice in each group. (D) CD4+ T-cell-mediated production of IL-2. Mice were infected as described for panel B. At the indicated times after primary (day 14 and day 21) or secondary (day 21 + 7 and day 21 + 28) infection, spleen cells were isolated and incubated for 48 h with heat-killed influenza virus. IL-2 production was then measured by monitoring CTLL-2 proliferation in the presence of serial dilutions (abscissa) of supernatant. Standard deviations are depicted. These results are representative of assays with three independent mice in each group. (E) T-cell anergy. Mice were injected intraperitoneally with SEB or PBS. After 14 days, CD4+ cells were purified and stimulated with the indicated concentrations of SEB in the presence of irradiated splenocytes. Proliferation (top panel) and IFN-γ production (bottom panel) were measured as detailed in the legend to Fig. 3A. In the experiment shown, 10 and 16% of purified CD4+ T cells were positive for Vβ8.1/2 in clnk+/+ and clnk−/− mice, respectively (data not shown). Standard deviations are shown.

