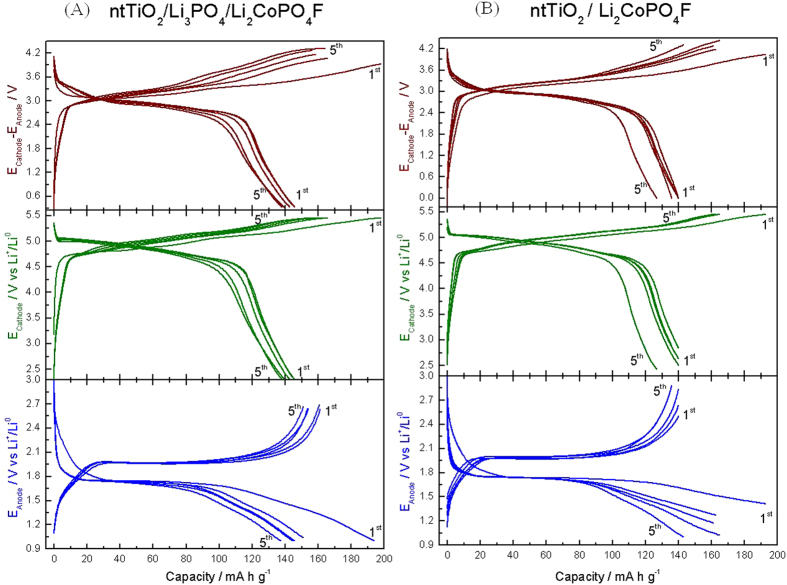
Figure 4.
Galvanostatic charge/discharge cycles representing the ECathode – EAnode vs. capacity of (A) nt-TiO2/γ-Li3PO4/Li2CoPO4F, and (B) nt-TiO2/Li2CoPO4F cells. This figure includes the voltage profiles of the cathode (ECathode vs. capacity) and the anode (EAnode vs. capacity) in the middle and bottom plots. The capacity of the full cell is calculated using the cathode mass.

