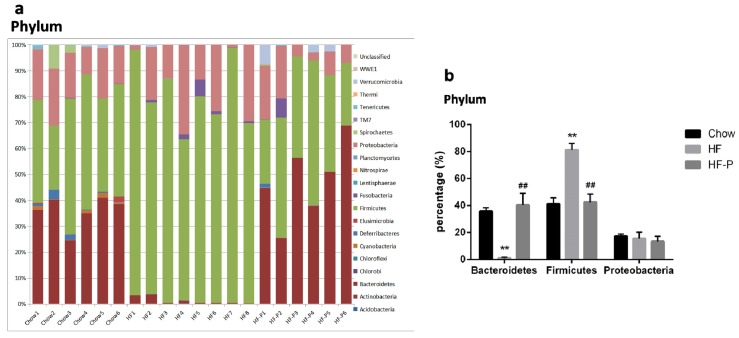
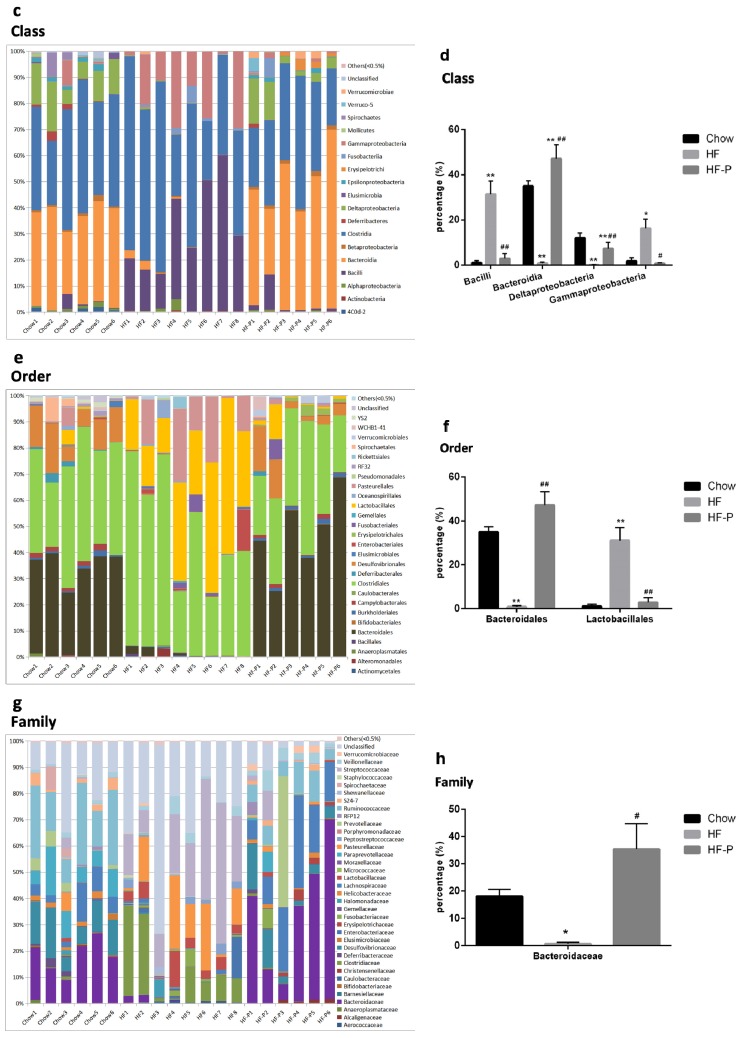
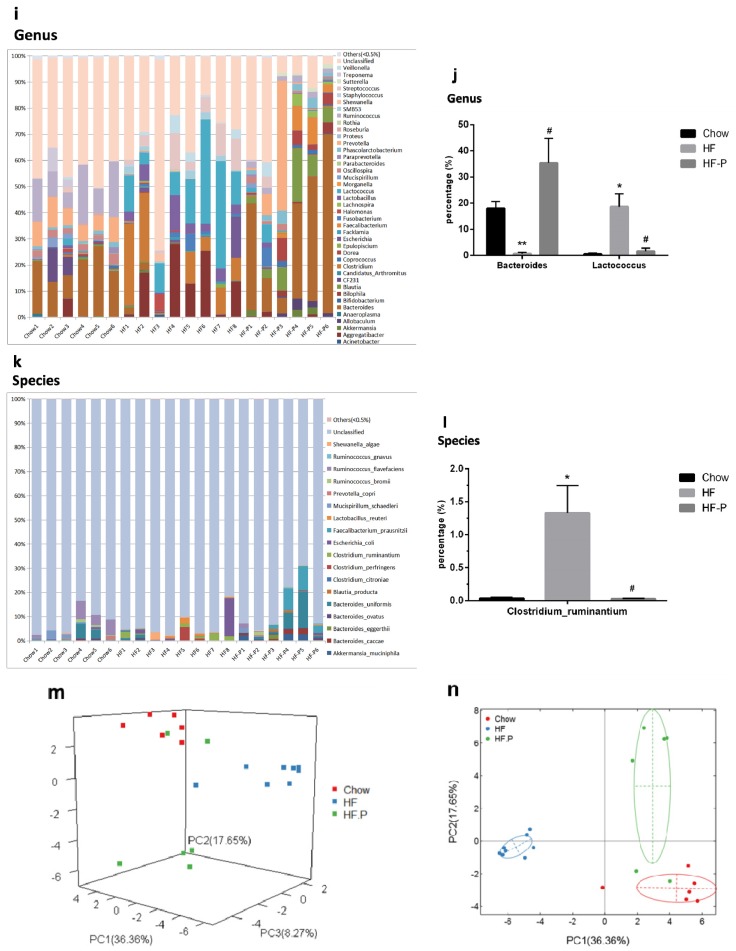
Figure 3.
Composition analysis of gut microbiota at the: (a,b) phylum; (c,d) class; (e,f) order; (g,h) family; (i,j) genus; and (k,l) species level in Chow, HF, and HF-P groups; (m) Principal component analysis (PCA) and (n) clustering analysis of gut microbiota in Chow, HF, and HF-P groups (** p < 0.01 vs. Chow, * p < 0.05 vs. Chow, ## p < 0.01 vs. HF, # p < 0.05 vs. HF, one way ANOVA).


