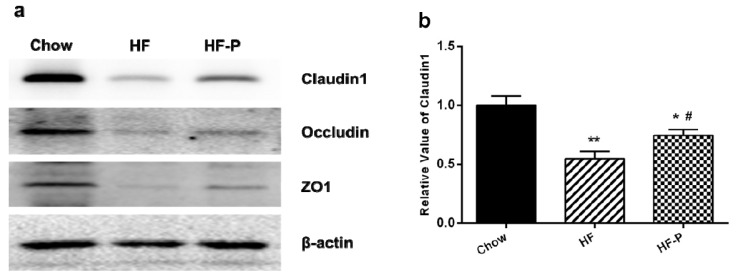
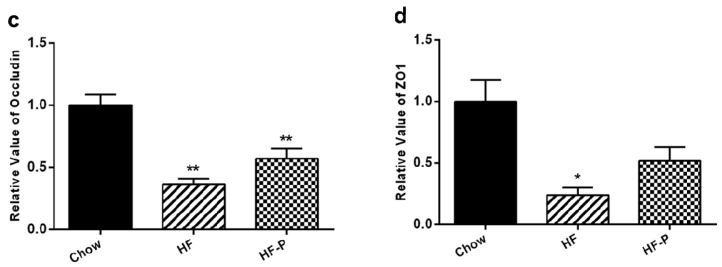
Figure 7.
Expression levels of the tight junction proteins claudin1, occludin, and ZO-1. (a) Representative Western blots of claudin 1, occludin, and ZO1 with β-actin as a loading control; Quantitation of: (b) claudin 1; (c) occludin; and (d) ZO1 (** p < 0.01 vs. Chow, * p < 0.05 vs. Chow, # p < 0.05 vs. HF, one way ANOVA).


