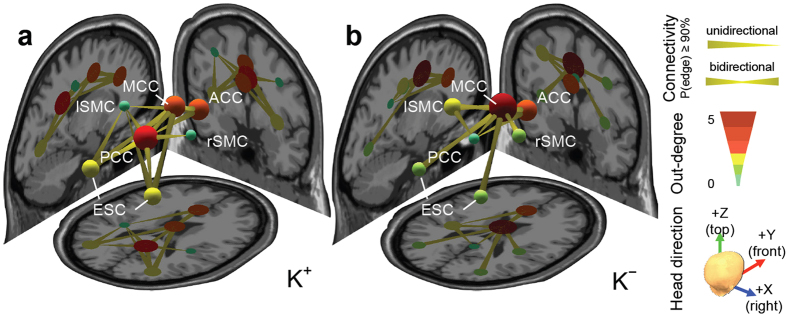
Figure 2. Brain network dynamics.
Effective connectivity between EEG independent processes estimated under (a) K+ and (b) K− conditions. Three-dimensional plot is formed with three anatomical MRI slices (left: sagittal view; right: coronal view; bottom: horizontal view) as background. Node represents anatomical location of each independent process, localized using a single, or dual-symmetric equivalent-current dipole model based on a four-shell spherical head model. Color of nodes represents degree of outflow. Edges represent causality directions. P(edge) ≥ 0.9 indicates that over 90% of participants have a significantly non-zero connectivity magnitude in that edge (see Supplementary Table 3). Out-degree indicates the number of outgoing edges.

