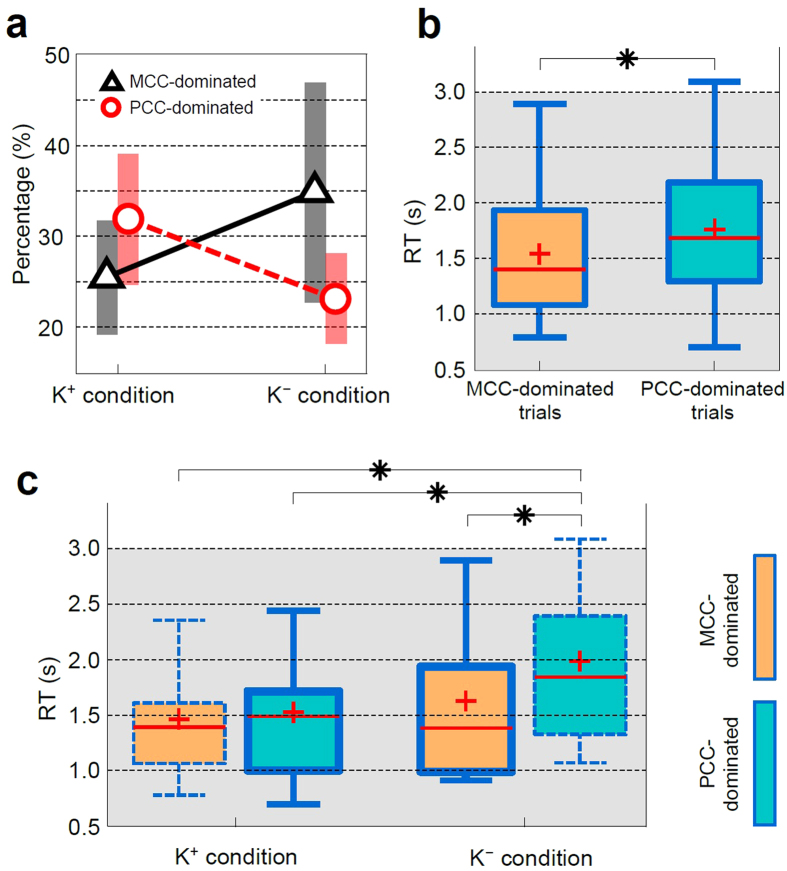
Figure 3. Differences of task performance between causal hubs.
(a) Percentages of MCC- and PCC-dominated trials under K+ and K− conditions. Each bar reflects 95% confidence intervals. (b) Box plots of the RT of the trials with MCC-dominated and PCC-dominated networks. Shown are median (horizontal line), mean (cross), 25% and 75% quartiles (box), and minimum and maximum values (error bars). (c) Box plots of the RT of the trials with MCC-driven and PCC-driven networks estimated in K+ and K−sessions. The bold boundary denotes the dominant network according to the connectivity shown in Fig. 2a,b. The comparison of the RT between networks and sessions were performed by Wilcoxon signed-rank test (FDR-corrected p < 0.05).

