
Figure 4. Change in out-degree across different task performance.
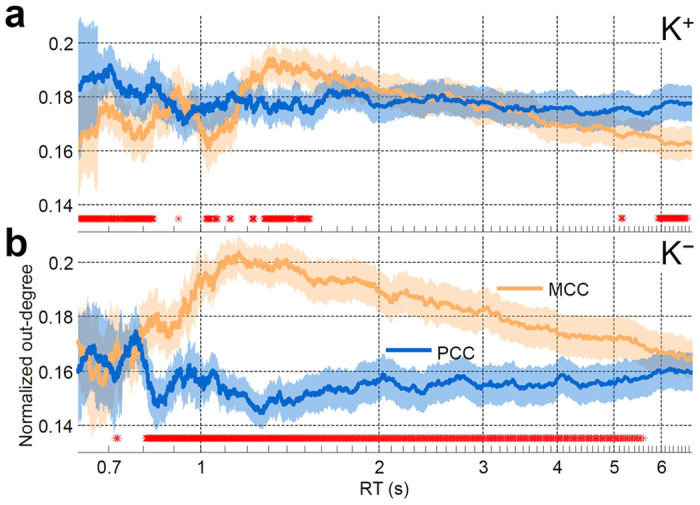
RT-sorted outflow dynamics of MCC (yellow trace) and PCC (blue trace) under (a) K+ and (b) K− conditions. For each trial, the out-degree was normalized by dividing the sum of significant outflow links of all brain regions. Then, the normalized out-degrees are horizontally stacked according to the RT from fast to slow and smoothed with a central moving average filter (window size: 10% of trials; window step: 1 trial)(see Methods). Red asterisks indicate that the difference between two traces is significant. Significant at FDR-adjusted p < 0.05.