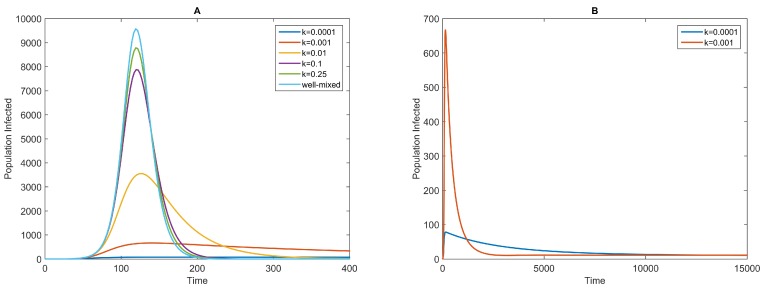
Figure 2.
Infectious curves for different values of k and fixed β for the negative binomial distribution (NBD) model (Equation (4)). The values of k are shown in the legend. The other parameters are as follows: , days, days and years. The initial conditions are and . The top curve in (A) is the infectious curve of the homogeneous-mixing model with a frequency-dependent transmission term [4]; it is compared to the infectious curves of the NBD model; (B) The long trend of the infectious curves of the NBD model with and .

