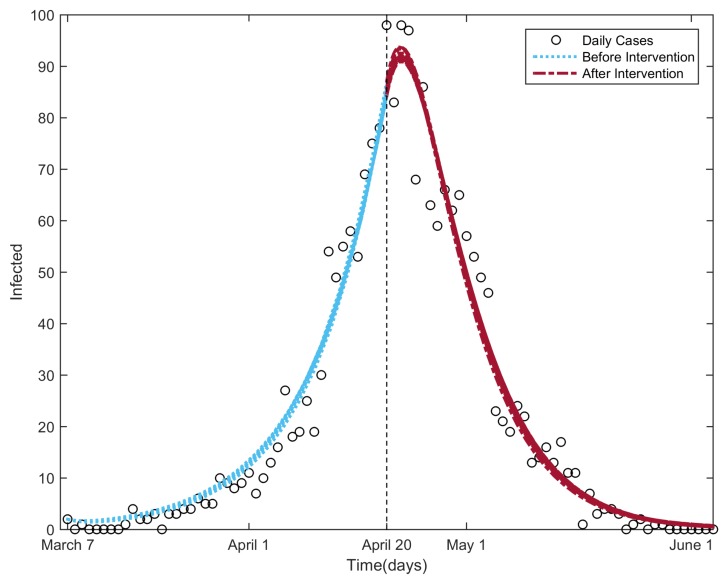
Figure 4.
Infectious curves for the fitting procedure of the NBD model to the SARS outbreak in Beijing in 2003. The circle markers denote the daily reported SARS cases; the parts of the curve to the left and right of the vertical line are the infectious curves before and after the control strategies were taken, respectively.

