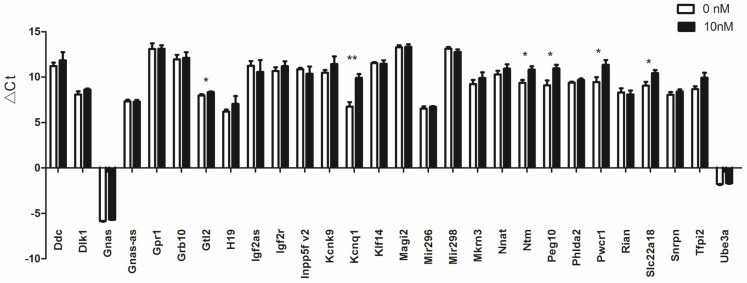
Figure 2.
Expression profile of 28 imprinted genes both expressed in control and GNRs treated TM-4 cells. Data are expressed as the mean ± SEM. X axis indicates the names of the imprinted genes both expressed in control and GNRs treated TM-4 cells. Y axis indicates the delta CT values for each imprinted genes (△Ct = Ct imprinted gene– Ct gapdh/U6). Sample number = 4, * p < 0.05; ** p < 0.01 vs. control.

