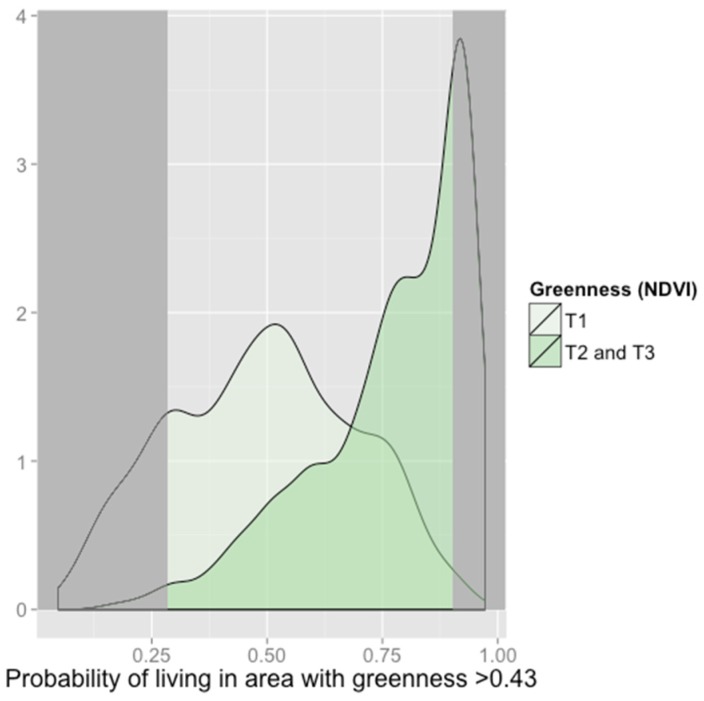
Figure 3.
Propensity score distributions for patients in cities comparing those with NDVI values in the 2nd and 3rd tertiles (darker green) to the 1st (lighter green). The propensity score is the predicted probability of living in tertiles 2 or 3 (NDVI > 0.43), given baseline covariates. The analysis was restricted to participants with propensity scores outside of dark grey shaded regions to ensure that those living in green and non-green environments were comparable.

