Figure 1.
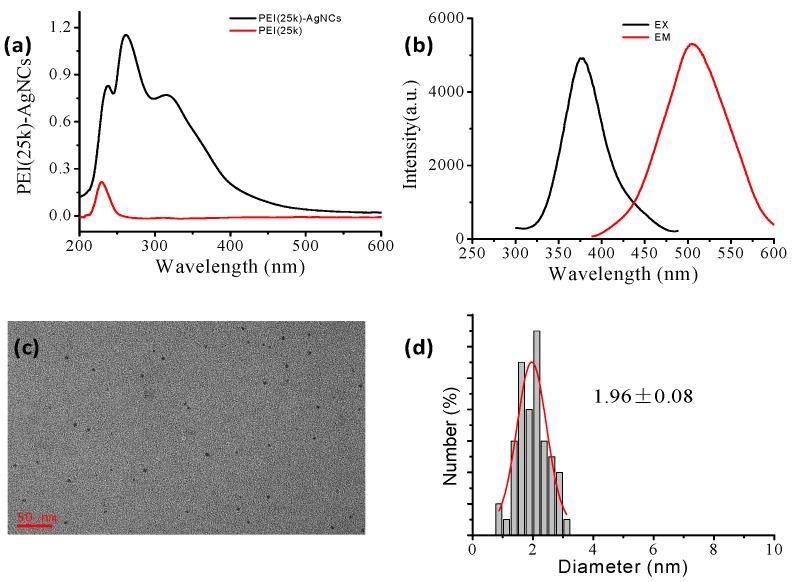
Characterizations of PEI25k-AgNCs. (a) The UV-Vis spectra of PEI-AgNCs (dark curve) and PEI (red curve); (b) The excitation (dark curve) and emission (red curve) spectra, where EX/EM represents the excitation/emission wavelength; (c) Their HRTEM image; (d) The corresponding statistic diameter.

