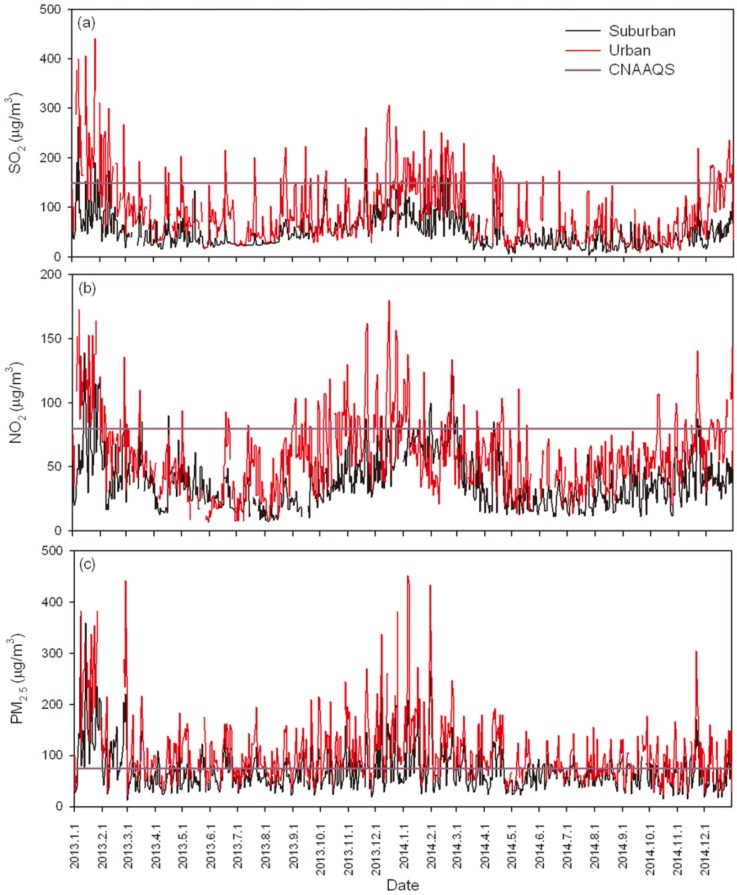
Figure 1.
Time series distributions of SO2, NO2 and PM2.5 in Jinan during 2013 to 2014. The horizontal lines in (a); (b) and (c) represent the standard daily average limits of SO2 (150 μg/m3), NO2 (80 μg/m3) and PM2.5 (75 μg/m3) in Chinese National Ambient Air Quality Standards (CNAAQS), respectively.

